So, what's a good sales conversion rate? The honest, if slightly frustrating, answer is: it depends.
There isn't some magic number that works for everyone. While you'll often hear people toss around an average of 2-3%, a truly "good" rate is completely defined by your business, your industry, where your leads come from, and even how much you're charging.
What Defines a Good Sales Conversion Rate

Think of it like a batting average in baseball. A power hitter who swings for home runs every time will have a very different "good" average than a contact hitter who just wants to get on base. Both strategies can win games, but you wouldn't judge them by the same number.
Your business is no different. The ideal conversion rate isn't a universal target; it's a number that makes sense for your specific context.
Benchmarks Are a Starting Point, Not a Finish Line
Industry benchmarks are a fantastic way to get your bearings, but they are just that—a starting point. They're not a finish line you have to cross.
For instance, a high-volume e-commerce store selling $10 t-shirts will naturally have a different conversion rate than a B2B company that needs multiple sales calls to close a five-figure deal. The context is completely different.
To see just how much this varies, it's worth looking at effective SMS marketing conversion rates and benchmarks. It's a great example of how different channels and business types have their own unique standards for success.
The most important benchmark is your own past performance. The goal should always be continuous improvement—turning today's good rate into tomorrow's great one.
To put this all into perspective, let's look at a high-level comparison.
A Quick Look at Average Sales Conversion Rates
The table below gives you a quick snapshot of how much "good" can vary depending on the business model and the type of lead you're working with.
| Business Model / Lead Type | Typical Average Conversion Rate |
|---|---|
| Ecommerce (General) | 1% – 4% |
| B2B SaaS (Free Trial) | 2% – 5% |
| B2B (Lead Gen Form) | 5% – 10% |
| B2B (Qualified Sales Call) | 15% – 25% |
As you can see, there's a huge range. A B2B company might be thrilled with a 10% conversion rate from a lead form, while an e-commerce store would be over the moon with a steady 4%. And as we dig deeper, you'll see how things like product category and lead quality create even more specific benchmarks.
Exploring Ecommerce Conversion Benchmarks
For a lot of businesses, the digital storefront is the main event. When you're playing in that space, a "good" sales conversion rate isn't one magic number. It's more of a spectrum, heavily influenced by things like where your customers are, how they behave online, and even how mature the digital market is in their region.
I like to think of it like comparing local farmers' markets. A busy market in a city with a long history of open-air shopping (think Europe) will probably see more browsers become buyers than a brand-new market in a town where people are still getting used to the idea. The same logic applies to ecommerce—familiarity and trust are huge.
This is exactly why you need to look past a single global average when setting your goals. A rate that’s considered just "average" in one part of the world could be a massive win in another. It really drives home the need for localized strategies that click with specific audiences and their unique buying habits.
A Look at Regional Differences
Geography is one of the biggest factors shaping ecommerce benchmarks. Different regions have completely different levels of digital payment adoption, logistics infrastructure, and consumer trust in online shopping. All of these directly hit conversion rates.
A global perspective is a nice starting point, but regional data gives you a much clearer, more actionable picture. For instance, more established ecommerce markets often see higher conversion rates because online shopping habits are deeply ingrained and payment systems are trusted.
Looking at the general data, the average conversion rate for direct website traffic hovers around 3.5%. But when you break it down by region, you get a more interesting story. The Europe, Middle East, and Africa (EMEA) region actually leads the pack with an average ecommerce conversion rate of 4.11%, with the Americas close behind at 3.56%. The Asia-Pacific (APAC) region averages 2.76%, which likely reflects the huge diversity in digital infrastructure across its many countries. You can dig into more detailed stats about industry and regional conversion rates on Invespcro.com.
Understanding these regional benchmarks is step one. Step two is figuring out how these numbers apply to your own sales process. Every visitor who lands on your site enters a journey, and optimizing that journey is how you turn their interest into a sale. This process is often visualized as a funnel, where you guide prospects from that first moment of awareness all the way to a final purchase. We break this down further in our guide on building an effective inbound sales funnel.
Why Location Matters for Your Strategy
These geographical differences aren't just trivia; they're packed with actionable insights. If your business operates in a region with lower average rates, you might need to invest more heavily in building trust. This could look like:
- Highlighting security badges to reassure customers that their payment info is safe.
- Offering familiar, local payment options to smooth out the checkout process.
- Showcasing customer reviews and testimonials from people in their region to build social proof.
On the flip side, a store in a high-conversion region is up against some serious competition. Here, the focus might shift to fine-tuning the user experience, personalizing offers, and creating a flawless mobile shopping journey just to stand out. At the end of the day, knowing your regional benchmark helps you put your resources where they’ll have the most impact and set growth targets you can actually hit.
How Product Categories Shape Your Conversion Rate
Not all products are created equal—and neither are their conversion rates. Asking "what is a good sales conversion rate?" without mentioning your product category is like asking for the right outfit without checking the weather. It just doesn't work.
A gourmet food store will almost always convert more visitors than an online luxury car dealership. And that's completely normal.
The reason boils down to simple psychology. Buying a $15 bag of artisanal coffee is a low-friction decision. It’s an affordable, simple purchase that doesn’t require much thought or deep research. On the flip side, buying a high-consideration item—think a car, a new sofa, or complex enterprise software—involves a much longer, more involved decision-making process.
Low-Friction vs. High-Consideration Purchases
Just think about your own shopping habits for a moment. You might toss a new snack into your digital cart without a second thought, maybe driven by a craving or a really compelling photo. That's a classic low-consideration purchase.
But what about when you need a new mattress? You'll probably spend days, if not weeks, digging into research. You'll compare brands, pour over customer reviews, analyze materials, and hunt for the best possible price. This is a high-consideration purchase, and because of all that upfront research, conversion rates are naturally lower for these items on any single visit.
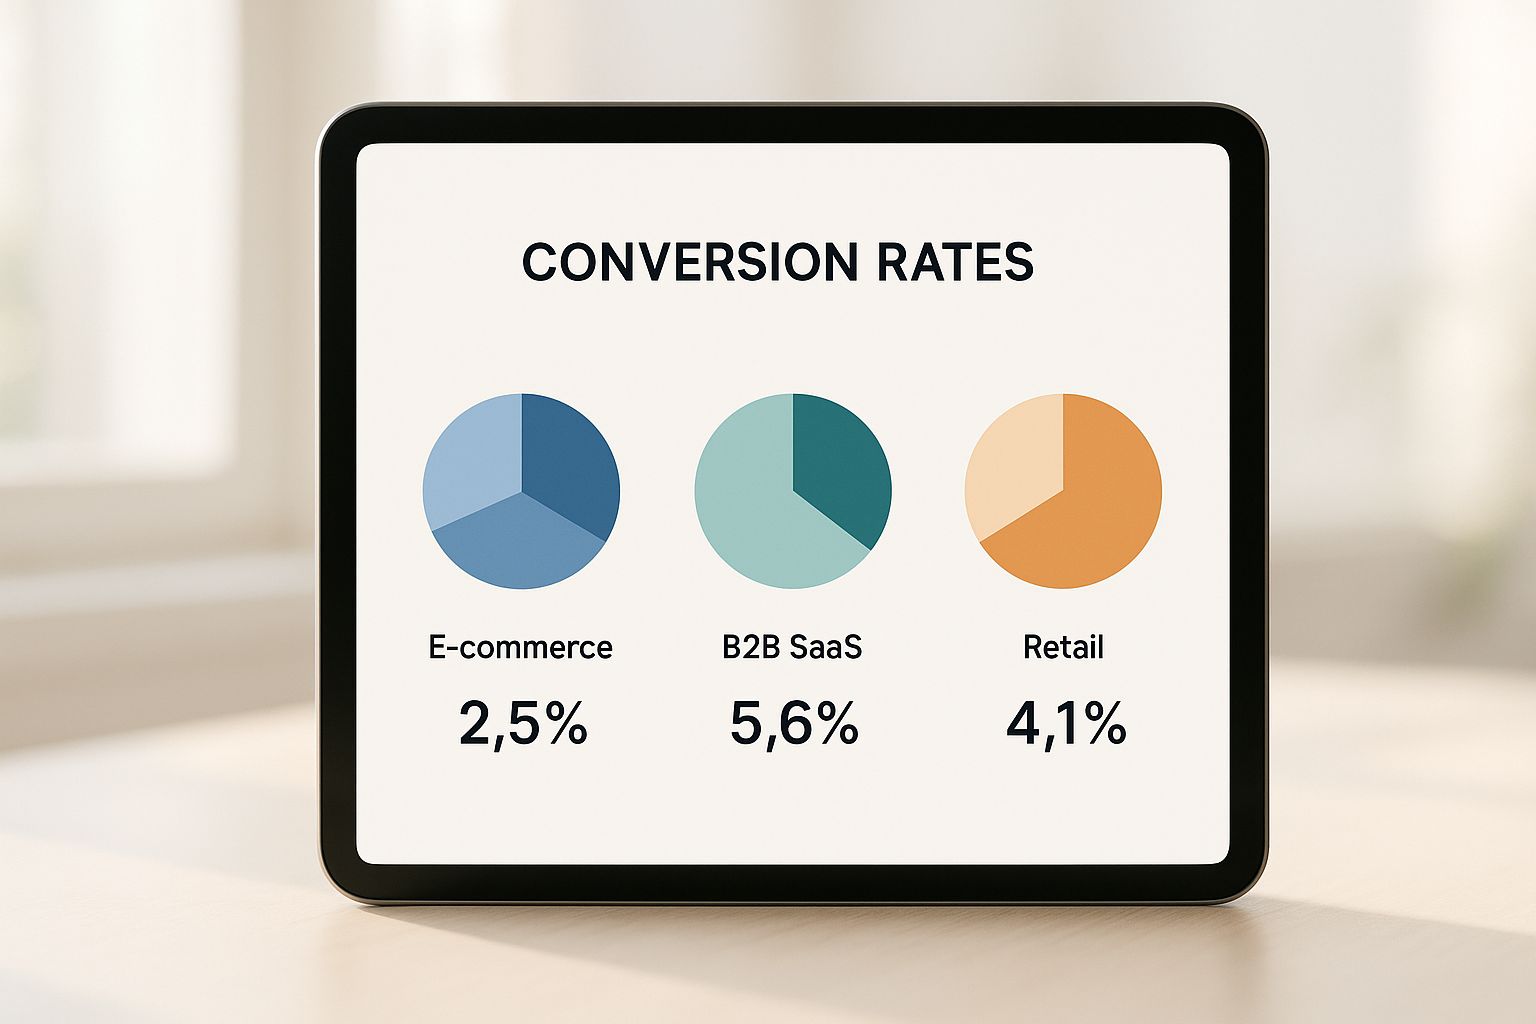
This infographic breaks down how these psychological differences show up in real-world conversion data across different types of businesses.

As you can see, what’s considered "good" for a B2B software platform is worlds away from an ecommerce store. It’s a powerful reminder that context is everything.
Industry Benchmarks: A Clearer Picture
This is exactly why looking at your specific industry benchmark is so much more useful than fixating on a generic global average.
Below is a table showing just how much conversion rates can differ from one ecommerce category to another, based on data from over 250 retail brands.
Average Ecommerce Conversion Rates by Industry
| Industry Sector | Average Conversion Rate |
|---|---|
| Food & Beverage | 6.2% |
| Home & Furniture | 5.0% |
| Consumer Goods | 4.8% |
While the overall ecommerce conversion rate hovers around 2.7%, the numbers above tell a more interesting story. Food and beverage leads the pack, while other sectors show solid, but different, performance. These figures underscore a crucial point: what you sell is one of the biggest factors defining your success.
If you want to dive deeper into the numbers, you can explore more of these conversion rate optimization statistics on BloggingWizard.
A good sales conversion rate isn't just a number; it's a reflection of your product's price, complexity, and the level of trust a customer needs to feel before clicking "buy."
Internalizing this relationship helps you set realistic goals. If you sell high-end electronics, trying to match the conversion rate of a fast-fashion brand is just a recipe for frustration.
Instead, focus on a more relevant benchmark: your own industry's average and, most importantly, your own historical performance. That's where you'll find the insights that truly matter.
Let's shift gears from website clicks to actual sales calls. When we do, the whole idea of a "good" conversion rate completely changes.
Suddenly, we’re not talking about anonymous website visitors anymore. We're talking about sales-qualified leads (SQLs)—real people who have been vetted and are actually ready for a conversation. Unsurprisingly, the conversion rates here are in a totally different league.
Think of it this way: an ecommerce store is casting a wide net, hoping to snag a few fish out of thousands swimming by. A sales call is more like spear-fishing. You've already spotted a specific fish, you're aiming carefully, and your chances of success are naturally way higher.
Of course, a lot can happen between "hello" and "closed-won." The quality of the lead is everything. A warm referral from a happy customer is worlds away from a cold lead who barely remembers filling out a form on your website three weeks ago.
What to Expect in High-Touch Sales
When you're dealing with high-touch sales, the product's price and complexity are huge factors. It’s one thing to sell a $50 gadget online; it’s a completely different ballgame to close a five-figure deal over the phone. These sales cycles are longer and demand a serious amount of trust-building.
This is where industry benchmarks become super helpful. A big meta-analysis looking at 25 different industries found that average sales call conversion rates tend to land somewhere between 13% and 25%.
Some sectors, like janitorial services or printing, often punch above that, seeing rates over 26%. This makes sense—the need is usually clear and the sales process is straightforward. On the flip side, complex B2B spaces like industrial equipment might fight to even hit 9%. The price tags are massive and the decision-making involves a whole committee. For a deeper dive, you can explore more industry-specific call conversion rates on focus-digital.co.
In direct sales, success isn't just about website metrics. It’s driven by the quality of the conversation and how effective your sales process is. A good rate simply shows your team is great at solving a specific, qualified need.
Why Lead Quality Is King
At the end of the day, a good sales call conversion rate isn't about hitting some magic universal number. It’s about how efficiently you turn real interest into real revenue. Two things really move the needle here:
- The Lead Source: Where did the lead come from? A warm referral, an inbound demo request, or a cold outreach campaign? Each source has a wildly different conversion potential baked right in.
- The Sales Process: How good is your team at handling objections, showing value, and guiding a prospect toward a decision? A polished, well-rehearsed process can make a massive difference.
So, for B2B sales teams, the goal isn't to compare your 20% close rate to an ecommerce store's 3%. That’s comparing apples and oranges. The real goal is to turn that 20% into 25% by sharpening your lead qualification and giving your reps the training and tools they need to win.
Key Factors That Influence Your Conversion Rate

While it's smart to keep an eye on industry benchmarks, they don't paint the whole picture. Your conversion rate really boils down to a handful of things you have direct control over. Think of these as the levers you can pull to turn more casual visitors into actual customers, no matter what your business is.
Getting a handle on these elements is the first real step toward making a difference. It’s about moving past just knowing your numbers and starting to actively change them for the better. Let's dig into the factors that have the biggest impact on your performance.
User Experience and Site Design
If there's one thing that matters most, it's your user experience (UX). A confusing or slow website is the digital equivalent of a messy store with a broken checkout counter—people will just walk out. Your site's design needs to feel intuitive, guiding visitors from the moment they land all the way to a purchase.
It's amazing what a small change can do. For instance, an online retailer saw their conversion rate jump from a measly 1% to 2% just by cutting their checkout process from five steps down to two. That simple tweak removed friction and literally doubled their sales. It’s proof that a smooth journey is a profitable one.
The Power of Product Imagery and Descriptions
Online, your customers can't pick up or touch your products, so your images and descriptions have to do all the heavy lifting. This is non-negotiable. You need high-quality, professional photos from several different angles to build trust and help people imagine themselves using your product.
Your product descriptions are just as crucial. They need to be sharp, compelling, and answer questions before a customer even thinks to ask them. Don't just list a bunch of features; talk about the benefits. Show them how your product solves a problem. A great description can be the final nudge someone needs to hit "Add to Cart."
A good sales conversion rate is rarely an accident. It's the direct result of a thoughtfully designed customer journey that builds trust and removes obstacles at every single step.
Site Speed and Mobile Optimization
We live in an era of instant gratification, and nobody has patience for a slow website. It's a total conversion killer. Study after study shows that even a one-second delay in page load time can send your conversion numbers plummeting. People expect a snappy, responsive experience, especially on mobile, where most of the browsing happens these days.
Making sure your site is fully optimized for mobile isn't just a "nice-to-have" anymore; it's essential for survival. If someone has to pinch and zoom just to read your text or can't easily tap a button, you've probably already lost that sale.
Social Proof and Trust Signals
People are hardwired to be influenced by what others are doing. That's the power of social proof, and it’s a huge driver for conversions. Here are a few of the most effective types:
- Customer Reviews and Ratings: There’s almost nothing more powerful than authentic feedback from other buyers.
- Testimonials: Showcasing glowing quotes from happy customers puts a human face on your brand and backs up your claims.
- Trust Badges: Displaying logos for secure payment options (like PayPal or Visa) and security certificates goes a long way in reassuring visitors that their information is safe.
All these pieces work together to build a strong foundation of trust. This is especially vital for effective B2B sales lead generation, where establishing credibility is the first step to even starting a conversation. When you master these factors, you create an environment where converting feels like the most natural thing for your visitors to do.
Actionable Strategies to Boost Your Sales Conversions
Knowing your numbers is one thing. Actually improving them is where the real work begins. It’s time to move from theory to action, which means systematically testing and refining every single touchpoint a potential customer has with your brand.
This isn’t about guesswork or gut feelings. It's about making deliberate, data-driven changes that convince more visitors to become buyers. These strategies are your playbook for lifting that conversion rate, targeting specific moments in the customer journey—from their first click to the final purchase decision.
Refine Your Messaging and Calls to Action
The words you choose have a massive impact. Your headlines need to grab attention and immediately communicate your value. Your call-to-action (CTA) must be impossible to misunderstand and compelling enough to click.
This is where A/B testing becomes your best friend. Don't assume you know what works. Test different headlines and CTAs to see what actually connects with your audience. Does "Buy Now" outperform "Get Started Today"? Small tweaks can lead to surprisingly big lifts in engagement and sales.
A great sales conversion rate is built on clear, persuasive communication. If your message is muddled or your CTA is weak, even the most interested prospects will hit the brakes.
You might discover that framing your CTA around a tangible benefit, like "Get Your Free Report," works far better than a simple command like "Download Now." Only rigorous testing will tell you what resonates. To really dig in, it's worth exploring a full range of website conversion rate optimization strategies.
Recover Lost Sales and Re-Engage Leads
Let's be realistic: most people won't buy on their first visit. That's completely normal. The real money is made by having systems in place to bring them back.
Here are two of the most powerful tactics you can implement right away:
- Build Cart Abandonment Sequences: When a shopper adds an item to their cart but bails without buying, an automated email can work wonders. A simple reminder an hour later, maybe followed by a small incentive the next day, can recover a shocking number of would-be lost sales.
- Leverage Retargeting Ads: Use targeted ads to gently remind people who visited your site about what they looked at. This keeps your brand fresh in their minds and gives them an easy one-click path back to your checkout page.
A well-structured follow-up is everything. For B2B sales, this often means a more sophisticated outreach plan. You can get some great ideas on how to structure this in our guide to sales cadence best practices.
Got Questions About Conversion Rates? We've Got Answers.
Alright, you've got the fundamentals down. But as soon as you start staring at your own data, the real-world questions pop up. It happens to everyone.
Think of this section as a quick huddle before you dive into optimizing. We'll tackle the most common head-scratchers so you can move forward with confidence and focus your energy where it'll actually make a difference.
How Long Until I See Results from Optimization?
This is the big one, isn't it? The honest answer is: it depends. It really boils down to your traffic volume and how big of a change you're making.
A bustling e-commerce site testing a new "Buy Now" button color might get a clear, statistically significant winner in just a few days. On the other hand, a B2B company testing a whole new landing page might need a few weeks—or even a month—to gather enough data to make a smart call.
The key here is patience. Calling a test too early based on a handful of conversions is a classic mistake that can send you down the wrong path.
As a solid rule of thumb, aim to get at least 100-200 conversions for each version you're testing. This helps ensure your results are more than just a random fluke.
Should I Focus on Traffic Quantity or Quality?
It’s so tempting to chase bigger traffic numbers. More visitors must mean more sales, right? Not necessarily.
Let's be blunt: quality beats quantity, nearly every time.
Think about it. Would you rather have 10,000 random visitors who stumble onto your site with zero interest, or 1,000 highly qualified prospects who are actively searching for exactly what you sell? The second group is where the money is.
Nail down your ideal customer first. Target your marketing to that person. Once you have a steady stream of the right people coming in and a conversion rate you're happy with, then you can open the floodgates and work on scaling up the quantity.
How Do I Attribute Conversions from Different Sources?
Knowing where your sales really come from is a game-changer. Did that new customer find you through a Google search, a social media ad, or that email you sent last week? Without proper tracking, you're just guessing.
This is where attribution models come in, and using a tool like Google Analytics with proper UTM tracking is non-negotiable.
- First-Touch Attribution: Gives 100% of the credit to the very first channel that brought a visitor to you.
- Last-Touch Attribution: Gives all the credit to the final touchpoint right before the sale. It's the simplest and most common starting point.
- Multi-Touch Attribution: This is the more advanced approach. It spreads the credit across several different touchpoints in the customer's journey, giving you a much more realistic picture.
Most businesses start with the simple last-touch model. But as you grow, moving to a multi-touch model will give you a much clearer view of what marketing efforts are truly driving your success.
Ready to turn more of your leads into customers? With Salesloop.io, you can automate your outreach, personalize your messaging, and track what's working—all in one place. Stop guessing and start converting. Explore how Salesloop.io can boost your sales today.


