
Think of your sales pipeline like a cross-country road trip. You could just start driving and hope for the best, but you’d probably hit dead ends, get stuck in traffic, and waste a ton of time and gas. You'd be guessing which roads actually lead to your destination.
Sales pipeline reporting is the GPS for your sales team. It takes all the raw data from your sales activities—every call, email, meeting, and demo—and turns it into a clear, visual map. You can see exactly where every single deal is on its journey, turning guesswork into a predictable path to hitting your numbers.
What Is Sales Pipeline Reporting, Really?
At its heart, this isn't just about making charts. It's about getting real answers to your most pressing questions. It’s the tool that moves your team from reacting to problems to proactively solving them before they derail a whole quarter.
A well-defined process, backed by solid reporting, makes a huge difference. In fact, a study from the Harvard Business Review found an 18% difference in revenue growth between companies with a formal sales process and those without one. Good reporting is the engine that drives that process.
From Raw Data to Actionable Intelligence
A good report doesn't just show you numbers; it tells you a story. It helps you dig deeper to understand why things are happening, so you can actually do something about it.
It's built to answer critical questions like:
- Are we on track to hit our quota? By seeing the total value of deals in each stage, you can build forecasts you can actually trust.
- Where are deals getting stuck? If you notice deals consistently falling off the map after the demo, your report is flagging a major bottleneck. Maybe your follow-up needs work, or your presentation isn't landing.
- Which reps need a hand? You can easily spot who’s a closing machine and who might be struggling to build their initial pipeline. This is how you offer coaching that makes a real impact.
- Is our lead quality good enough? If you're seeing a flood of new leads that never progress to the opportunity stage, that’s a clear sign you need to have a conversation with marketing.
This is how you turn a pile of CRM data into intelligence you can act on. Instead of scrambling at the end of the month when you've missed your target, you can see the problem coming weeks in advance and adjust your strategy. To really nail this, you need to understand the fundamentals of what makes for effective sales pipeline reporting, as it's the foundation for any successful system.
The True Purpose of Reporting
Let's be clear: the goal isn't just to generate pretty dashboards to show in a meeting. The whole point is to trigger smart, profitable actions that move the needle on revenue.
An effective report is the difference between a manager saying, "We just need to sell more," and a manager saying, "Our conversion rate from proposal to negotiation is down 15% from last quarter. Let's focus our next training session specifically on objection handling." See the difference?
This strategic view gives everyone in the sales organization—from the rep planning their week to the executive mapping out next year's growth—a shared language and a single source of truth. It gets the entire team aligned on what it actually takes to win.
The Health Metrics Your Pipeline Depends On

Think of your sales pipeline not as a simple list of leads, but as a living, breathing system. Just like a doctor checks vital signs like heart rate and blood pressure, a sales leader needs to monitor key performance indicators (KPIs) to truly understand the health of their revenue engine.
It’s easy to get fixated on surface-level numbers like total leads, but that doesn’t tell you the whole story. The real insights come from metrics that show how efficient, fast, and high-quality your entire sales process is. These are the numbers that help you spot trouble long before it torpedoes your quota.
For example, a pipeline that's overflowing with new leads might look fantastic on paper. But if your average sales cycle is getting longer and longer, you might have a lead quality problem, not a productivity boom. It’s all about learning to read the chart, not just counting the patients in the waiting room.
Core Metrics for Pipeline Vitality
To get a real grip on performance, you need to zero in on a handful of metrics that work together. Each one gives you a different angle on your pipeline, and when you put them all together, they paint a complete, actionable picture.
“Effective pipeline reporting provides visibility not just on closed deals, but on the entire journey. This means monitoring how many opportunities you have, how fast they’re moving, what they’re worth, and how often they convert.”
Here are the absolute must-have KPIs that should be front and center on your reporting dashboard:
- Total Open Opportunities: This is your at-a-glance number of active deals. It gives you a quick snapshot of the total volume your team is juggling at any given moment.
- Average Deal Size: By calculating the average value of all your open opportunities, you can get a much better handle on potential revenue and see if your team is focusing on the right, high-value prospects.
- Win Rate (or Close Rate): This one’s straightforward—it’s the percentage of your opportunities that actually turn into closed-won deals. If this number is low, it’s a big red flag for issues in your qualification process, value proposition, or even competitive pressure.
- Sales Cycle Length: This tracks the average time it takes for a deal to go from a fresh opportunity to a closed deal. If this number starts creeping up, it’s a critical warning that there’s friction somewhere in your sales process that needs fixing.
Advanced Diagnostic Metrics
Once you've got the basics locked down, you can dig deeper with more advanced metrics. These are the KPIs that help you analyze the flow and efficiency of your pipeline, not just its size. This is where reporting evolves from a simple scorecard into a powerful strategic tool.
Let’s be honest, many sales teams stop at win rates and lead counts, which is a recipe for unreliable forecasting. The best teams go further, tracking things like how quickly new qualified leads are coming in, how deals move from one stage to the next, and the overall length of the sales cycle. This next level of analysis is all about looking at the transitions between your sales stages.
To help you get started, here's a breakdown of the key metrics that give you a true health check on your pipeline's performance.
Key Sales Pipeline Health Metrics Explained
| Metric Name | What It Measures | Why It's Important |
|---|---|---|
| Stage Conversion Rate | The percentage of deals that successfully move from one pipeline stage to the next. | Highlights specific bottlenecks where deals most often stall or are lost, allowing for targeted coaching. |
| Lead Velocity Rate | The month-over-month growth in qualified leads. | Acts as a powerful leading indicator of future revenue growth, showing if your pipeline is growing or shrinking. |
| Pipeline Coverage | The ratio of your open pipeline value to your sales quota. | Shows if you have enough opportunities in the works to realistically hit your target. A 3x ratio is a common benchmark. |
By keeping a close eye on these KPIs, you give yourself the data to make smart, proactive decisions. If your B2B sales lead generation is firing on all cylinders but your stage conversion rates are weak, you know you need to focus on sales skills and process refinement, not just pouring more leads into the top.
This is how you turn your reporting from a backward-looking historical document into a forward-looking guide that actually helps you win.
Building a Report That Actually Gets Used
Let’s be honest. An elaborate sales pipeline report that takes hours to build is completely useless if no one on your team ever looks at it. The best reports aren't the most complicated; they're the most actionable. Building a report that your team actually finds indispensable starts with simplicity and a clear focus on telling a story with data.
The foundation of any good report is a set of non-negotiable sales stages. These stages absolutely must mirror the real-world journey your prospects take, from their first "hello" to the final handshake. If there's any ambiguity here, you're going to end up with messy data and forecasts you can't trust. Get this right from the start.
Define Your Sales Stages Clearly
Your sales stages are the very building blocks of your entire reporting structure. They need to be concrete, universally understood by every single person on your team, and have crystal-clear entry and exit criteria. Think of them like signposts on a highway; each one tells you exactly where a deal is and what has to happen to get to the next one.
Here’s a common, effective set of stages that works for many teams:
- Lead/Inquiry: A new prospect has entered your world, maybe through a website form or some outbound prospecting. The key here is that no two-way communication has happened yet.
- Contact Made: You’ve broken the ice. A real conversation with the prospect has been initiated.
- Qualified: This is a huge step. You’ve confirmed the prospect has the need, budget, and authority to actually buy (you might know this as BANT).
- Proposal/Demo: Things are getting serious. You've presented your solution and sent over a formal proposal or quote.
- Negotiation/Review: The prospect is looking over your proposal, and you're actively hammering out the final terms.
- Closed Won/Lost: It's official. The deal is either signed and won, or the prospect has decided not to move forward.
These stages create a logical flow that transforms a simple, messy list of deals into a process you can actually manage and measure.
This flow helps you see exactly how leads are progressing through your pipeline. The conversion rates you track at each step will show you where you're creating value—and where deals are falling through the cracks.
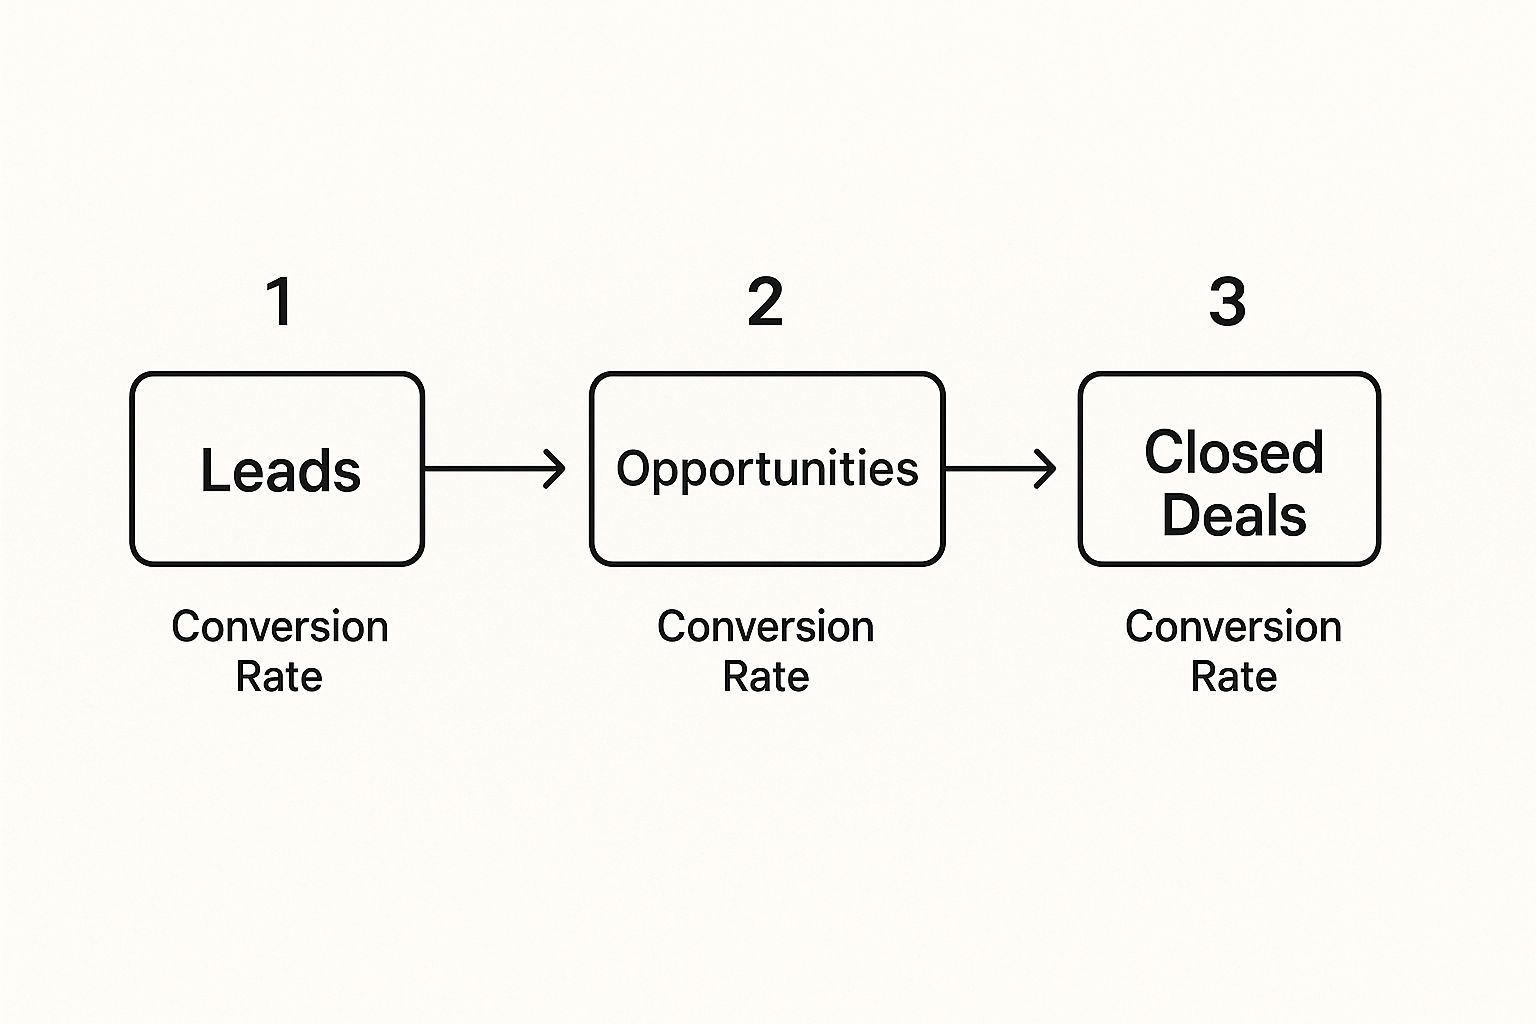
As this visualization shows, you might have a flood of leads entering the top of the funnel, but their real value and likelihood to close increase dramatically as they move from one stage to the next.
Pull the Right Data and Visualize It
Once your stages are locked in, it's time to pull the right data from your CRM. The goal isn't to grab every single data point you can find. Instead, you want to be selective and choose the metrics that answer your most pressing questions. Start with the essentials: number of deals per stage, average deal size, and sales cycle length.
Next up, visualization. A wall of numbers is just intimidating, but a well-designed chart can reveal powerful insights in a matter of seconds. You don't need a fancy, complex business intelligence platform to get started; most modern CRMs have powerful, built-in dashboard capabilities that get the job done.
The most impactful sales pipeline reporting translates raw numbers into a clear narrative. A sales manager should be able to glance at a report and immediately spot which deals are at risk, which reps need support, and whether the team is on track to hit its quarterly goals.
Tailor the Report for Your Audience
A one-size-fits-all report rarely works. Why? Because different people need different information. A report that tries to be everything to everyone ultimately ends up being useful to no one. To make your reporting truly effective, you have to tailor the view to the person looking at it.
- For Sales Reps: The report should be their daily command center. Focus on their individual pipeline, what activities are coming up, and how they're tracking toward their personal quota. Keep it simple and focused on what to do next.
- For Sales Managers: Managers need to see the bigger picture. Their report should cover team performance, stage-by-stage conversion rates to spot bottlenecks, and individual rep metrics to guide coaching sessions.
- For Executive Leadership: The C-suite needs the 30,000-foot view. They care about the total pipeline value, revenue forecasts, and the overall health of the pipeline against company goals. They're looking for strategic trends, not the status of individual deals.
By creating these distinct views, you ensure that every person in the organization gets relevant, actionable information. This is how your sales pipeline reporting stops being a chore and starts being a central part of your sales culture.
From Data Overload to Actionable Insights

Having the right metrics and a slick-looking report is a great start. But let's be honest, the real power of sales pipeline reporting isn’t in the data itself—it’s in the stories that data tells you. A report that just sits on a virtual shelf is a wasted effort; a report you can actually interpret becomes a strategic weapon.
This is where you graduate from just tracking numbers to actively diagnosing the health of your entire sales process. It’s about learning to read between the lines, spotting hidden patterns, and understanding the why behind your results. Think of it as the difference between knowing your win rate and knowing exactly what’s causing it to tank.
Diagnosing Common Pipeline Problems
Your sales pipeline report is basically a diagnostic scan of your revenue engine. Once you know what to look for, specific patterns will jump out, pointing directly to the underlying issues. Put on your detective hat—you're looking for clues that reveal what's really happening on the sales floor.
Here are a few classic problems you can spot just by looking at the shape and flow of your pipeline data:
- The Middle-Stage Bulge: Does your pipeline chart look fat in the middle and skinny at both ends? That's a classic bottleneck. A "bulge" at the proposal or demo stage means deals are getting in, but they're hitting a wall and not moving forward. This could point to weak presentations, an unclear value proposition, or simply a lack of follow-up.
- The Leaky Funnel: Are you losing a ton of deals at one particular stage? If you see a massive drop-off from "Qualified" to "Proposal Sent," it might mean your qualification criteria are too loose. Your reps are likely wasting precious time on prospects who were never going to buy in the first place.
- The Shrinking Deal Size: Is your average deal size on a steady downward trend? This is a huge red flag. It could mean your reps are handing out discounts like candy to close deals, or maybe your marketing is attracting smaller, lower-value clients. It's a clear signal to take a hard look at your pricing or lead sources.
Turning Observations Into Concrete Actions
Spotting the problem is only half the battle. The magic happens when you use these insights to make specific, data-driven tweaks to your sales strategy. This is how you turn your report from a passive document into a playbook for improvement.
The ultimate goal of sales pipeline reporting is not just to know what happened, but to influence what happens next. Every chart and every metric should lead to a question, and every question should lead to a potential action.
Let's break down how to connect what you're seeing to tangible next steps. This framework helps you build a feedback loop where data directly fuels your strategy.
A Framework for Action
| Observation (The "What") | Potential Diagnosis (The "Why") | Actionable Strategy (The "How") |
|---|---|---|
| Pipeline is 'bulging' at the proposal stage. | Reps may be struggling with objection handling or lack strong closing skills. | Schedule targeted sales training focused on negotiation and closing techniques. |
| Average deal size is shrinking. | Marketing campaigns are attracting smaller clients, or reps are over-discounting. | Refine marketing targeting to focus on ideal customer profiles. Review and tighten discount approval policies. |
| Sales cycle is getting longer. | The follow-up process is inconsistent, or deals are not being nurtured effectively. | Implement a standardized follow-up sequence for all reps. Explore ways to automate lead generation and nurturing to ensure no prospect falls through the cracks. |
| Win rate is low despite high lead volume. | Lead qualification is weak, and the team is pursuing poor-fit prospects. | Redefine your Sales Qualified Lead (SQL) criteria and provide training on how to disqualify leads early. |
By systematically turning data into action, you create a culture of continuous improvement. Your sales pipeline reporting becomes the central nervous system of your sales organization, guiding everything from one-on-one coaching to high-level strategic planning. This process ensures your team is always adapting and getting better based on real performance data, not just gut feelings.
The Daily Habits of Top-Performing Sales Teams
Exceptional pipeline management isn't a project you tackle once and then forget about. It's a daily discipline. The best sales teams have a set of ingrained habits that separate them from the pack, and it all comes down to consistency.
They don't just wait for the end-of-month scramble and hope for the best. They build momentum every single day through focused, deliberate actions.
This daily rhythm is powered by solid sales pipeline reporting. For top performers, this report isn't some dusty document that gets glanced at once a week. It's a live, active tool that shapes their daily priorities. It’s the difference between hoping for results and actually engineering them.
Think of it like an athlete's training log. A world-class sprinter doesn't just show up on race day. They obsessively track their daily workouts, their nutrition, and their recovery. In sales, that means tracking the daily inputs that lead to future wins.
Mastering Daily Inputs and Momentum
The bedrock of a healthy pipeline is consistent, daily activity. You can't always control when a deal will close, but you have absolute control over the effort you put in today. This is where daily reporting becomes non-negotiable. It’s your scorecard for the actions that will fill your pipeline tomorrow, next week, and next quarter.
A huge part of this is tracking metrics like the number of Sales Qualified Leads (SQLs) added, follow-ups completed, and your lead response time. Adding new SQLs is like planting seeds for future revenue. Quick follow-ups and rapid responses are like watering those seeds—they dramatically boost your chances of seeing them grow.
These daily inputs are the leading indicators of future success. A drop in new conversations today will almost certainly become a revenue gap 60 or 90 days from now.
The daily huddle isn't just a status update; it's a forward-looking strategy session. It's where reps declare what they're tackling, and managers can jump in to unblock a stalled deal or share a tactic that just worked.
The Anatomy of a Productive Review
So, how do the best teams actually use their sales pipeline reports in daily and weekly reviews? They don't just read off numbers. They use the data to spark productive, action-oriented conversations that celebrate what's working and tackle challenges head-on.
Here’s a practical checklist for structuring these reviews:
-
Daily Huddle (15 Minutes):
- Wins from Yesterday: What moved forward? What progress did we make?
- Priorities for Today: Which high-value deals are getting attention?
- Roadblocks: Where are you stuck? Who needs help?
-
Weekly Pipeline Review (60 Minutes):
- Pipeline Health Check: Do we have enough pipeline coverage to hit our number?
- Stage-by-Stage Analysis: Where are deals getting stuck? Are conversion rates looking healthy?
- At-Risk Deals: Which opportunities haven't seen activity? Let's build a plan to re-engage them.
- Forecasting Check-in: How has our forecast changed since last week, and why?
This kind of structured approach transforms reporting from a passive chore into an active coaching and strategy tool. It ensures no deal slips through the cracks and that the entire team is pulling in the same direction, every single day.
Choosing Your Sales Reporting Toolkit

Great sales reporting isn’t just about having the right process. It’s about having the right tech to make it all click—to automate the tedious stuff and scale up what works. Picking the right tools can be the difference between crystal-clear, data-driven decisions and being perpetually stuck wrestling with messy spreadsheets. This software becomes the heart of your sales data, so choosing wisely is non-negotiable.
The good news? Powerful tools are more accessible than ever. The market for sales pipeline software is booming, expected to jump from $3.8 billion in 2023 to a massive $10.2 billion by 2032. This explosion is happening because more companies are realizing they need to get their data integrated and their sales process dialed in to stay competitive.
CRM Dashboards vs. Business Intelligence (BI) Tools
So, where do you start? Your first big decision usually comes down to this: do you use the reporting features already built into your CRM, or do you bring in a specialized Business Intelligence (BI) tool?
There’s no single "best" answer here. The right choice really depends on your team's specific needs, your budget, and how comfortable everyone is with new tech. To really get a handle on your sales pipeline, a comprehensive CRM solution is pretty much table stakes. Most modern CRMs come with great out-of-the-box dashboards that are more than enough for many teams.
The best tool for the job is the one your team will actually use every day. Overly complex software with a steep learning curve often ends up collecting dust, no matter how powerful its features are.
For a lot of small to mid-sized teams, the reporting that comes with your CRM is perfect. It gives you instant access to your core metrics without needing a data analyst or a complicated setup. It keeps everything in one place, connecting your reports directly to your day-to-day sales activities. Simple and effective.
Making the Right Choice for Your Team
But what happens when your company starts to grow? Your data gets more complicated. You might find yourself needing to pull in data from marketing, finance, or even the product team to get the full picture.
This is where dedicated BI tools really start to shine. They offer much deeper customization and can handle huge datasets from all over the business. If you're exploring your options, our guide on the top sales pipeline software is a great place to start.
Here’s a quick breakdown to help you figure out which path to take:
-
Choose a CRM's built-in reporting if:
- You’re a small or medium-sized team.
- Your reporting needs are almost exclusively about sales activity.
- You're working with a tight budget and need something that’s fast and easy to set up.
- You love the idea of a single platform for managing deals and reporting on them.
-
Consider a dedicated BI tool if:
- You're a large company with seriously complex data needs.
- You have to blend sales data with info from other departments (like marketing or finance).
- You have a data analyst on staff or a team that’s comfortable with more technical tools.
- You need highly specific, granular visuals or want to build predictive models.
Common Questions About Sales Pipeline Reporting
Once you start digging into sales data, a few common questions always pop up. Getting straight answers to these is what separates a report that just sits there from one that actually drives your strategy and day-to-day decisions.
Let's break down some of the most frequent questions sales leaders ask. Think of this as a quick FAQ to clear up any confusion and help you fine-tune your approach.
How Often Should We Review Our Pipeline Report?
There’s no magic number here—it really boils down to the length of your sales cycle. But whatever you choose, you need a steady rhythm.
- Daily Self-Review: Every rep should take five minutes at the start of their day to scan their own pipeline. This is a quick gut-check to prioritize who to call and focus their energy on the deals that are ready to move.
- Weekly Team Review: This one's non-negotiable for sales managers. A weekly team pipeline review is the perfect time for coaching, spotting roadblocks, and making sure you have enough in the pipeline to actually hit your number for the month or quarter.
- Monthly or Quarterly Leadership Summary: The execs don't need to be in the weeds. A high-level summary once a month or every quarter is usually perfect. This keeps them updated on overall pipeline health, revenue forecasts, and bigger-picture trends.
The most important thing? Consistency. When these reviews become a fixed part of your routine, everyone stays aligned and accountable.
What Is the Biggest Mistake to Avoid?
The single most damaging mistake I see is focusing only on lagging indicators, like closed-won revenue. Sure, that number is important, but it only tells you what already happened. It's like trying to drive a car by looking exclusively in the rearview mirror.
Great reporting strikes a balance. It uses lagging indicators for context but focuses on leading indicators to predict the future. Things like the number of new qualified opportunities, stage-to-stage conversion rates, or sales cycle length—these are the metrics that tell you where you're headed. A report that doesn't inspire action is just a scorecard.
The real goal is to use your data to make smarter, proactive calls that will change next month's outcome, not just re-hash last month's.
Can We Manage Reporting Without a CRM?
Look, you can technically track your deals in a spreadsheet. But for any team that's serious about growth, it's an incredibly risky and inefficient way to operate. Manual data entry is just asking for human error, outdated info, and zero real-time insight.
A Customer Relationship Management (CRM) system isn't a luxury; it's the foundation for any serious reporting. It automates most of the data entry, acts as the single source of truth for your entire sales process, and makes pulling accurate reports almost effortless. For any modern sales team, a CRM is table stakes.
Ready to scale your outreach and accelerate pipeline growth? Salesloop.io empowers B2B teams to build automated, multi-channel campaigns that drive engagement and book meetings. Move beyond manual follow-ups and see how our platform can fill your pipeline with qualified leads. Start your journey at https://salesloop.io.

How to Write Cold Emails That Get Replies