
Unlocking Sales Success: The Metrics That Matter
Want to boost sales performance? You need to track the right metrics. This listicle provides seven crucial sales performance metrics examples you should be monitoring in 2025. Learn how to interpret metrics like Revenue Growth Rate, Customer Acquisition Cost (CAC), Customer Lifetime Value (CLTV), Sales Conversion Rate, Average Deal Size, Sales Cycle Length, and Sales Activity Metrics. Understanding these key performance indicators (KPIs) allows data-driven decisions, optimizes strategies, and fuels revenue growth. Let's dive in.
1. Revenue Growth Rate
Revenue Growth Rate is a crucial sales performance metric that measures the percentage increase or decrease in a company's revenue over a specific period. This metric provides a snapshot of your business's overall health, sales effectiveness, and market performance. It’s a fundamental indicator for understanding your trajectory and making informed decisions about future strategies. Whether you're a solo sales professional, part of a small-to-medium sized B2B sales team, a marketing agency, or a large enterprise, tracking revenue growth rate is essential for success. This metric deserves its place on any list of key sales performance indicators because it directly correlates with business growth and sustainability.
Calculating Revenue Growth Rate is straightforward:
(Current Period Revenue – Previous Period Revenue) / Previous Period Revenue × 100
This simple formula can be applied across various timeframes, offering flexibility in analysis. Common periods include month-over-month (MoM), quarter-over-quarter (QoQ), and year-over-year (YoY). This flexibility allows businesses to track short-term performance fluctuations as well as long-term trends. For example, an e-commerce business might closely monitor MoM growth during peak seasons, while a SaaS company might focus on annual recurring revenue growth (YoY) to assess overall business health. B2B companies often analyze QoQ growth to understand sales cycles and the impact of their sales strategies.
Features and Benefits of Tracking Revenue Growth Rate:
- Measurable across different time periods: Track progress on a monthly, quarterly, or annual basis for a comprehensive view of performance.
- Benchmarkable against industry standards: Compare your growth rate to competitors and identify areas for improvement.
- Reflects both quantity and quality of sales efforts: A high growth rate suggests not only increased sales volume but also potentially improved pricing strategies and customer acquisition.
- Indicates market demand and competitive positioning: Strong revenue growth can signify a healthy market and a competitive advantage.
Pros:
- Simple to calculate and understand: The formula is easy to implement and interpret.
- Directly correlates with business success: Revenue growth is a primary indicator of a thriving business.
- Useful for forecasting and planning: Past growth trends inform future revenue projections and resource allocation.
- Easily communicated to stakeholders: This metric clearly conveys business performance to investors, management, and team members.
Cons:
- Doesn't account for seasonality without context: Fluctuations due to seasonal trends can be misinterpreted without careful analysis.
- May mask underlying issues like customer churn: While revenue may be growing, high customer churn can indicate future problems.
- Can be influenced by one-time events: Large, one-time deals can skew growth figures and create an inaccurate picture of consistent performance.
- Doesn't show profitability or efficiency: Revenue growth alone doesn't reveal the profitability or efficiency of sales operations.
Actionable Tips for Using Revenue Growth Rate:
- Compare growth rates across multiple periods for trends: Analyze MoM, QoQ, and YoY data to identify consistent patterns and potential issues.
- Segment by product lines or customer types: Pinpoint specific areas of strength and weakness within your sales portfolio.
- Adjust for seasonal variations when relevant: Normalize data to account for predictable fluctuations in demand.
- Set realistic growth targets based on market conditions: Align your goals with industry benchmarks and current market trends.
The following bar chart visualizes a hypothetical company's Revenue Growth Rate across three key periods: Month-over-Month, Quarter-over-Quarter, and Year-over-Year.
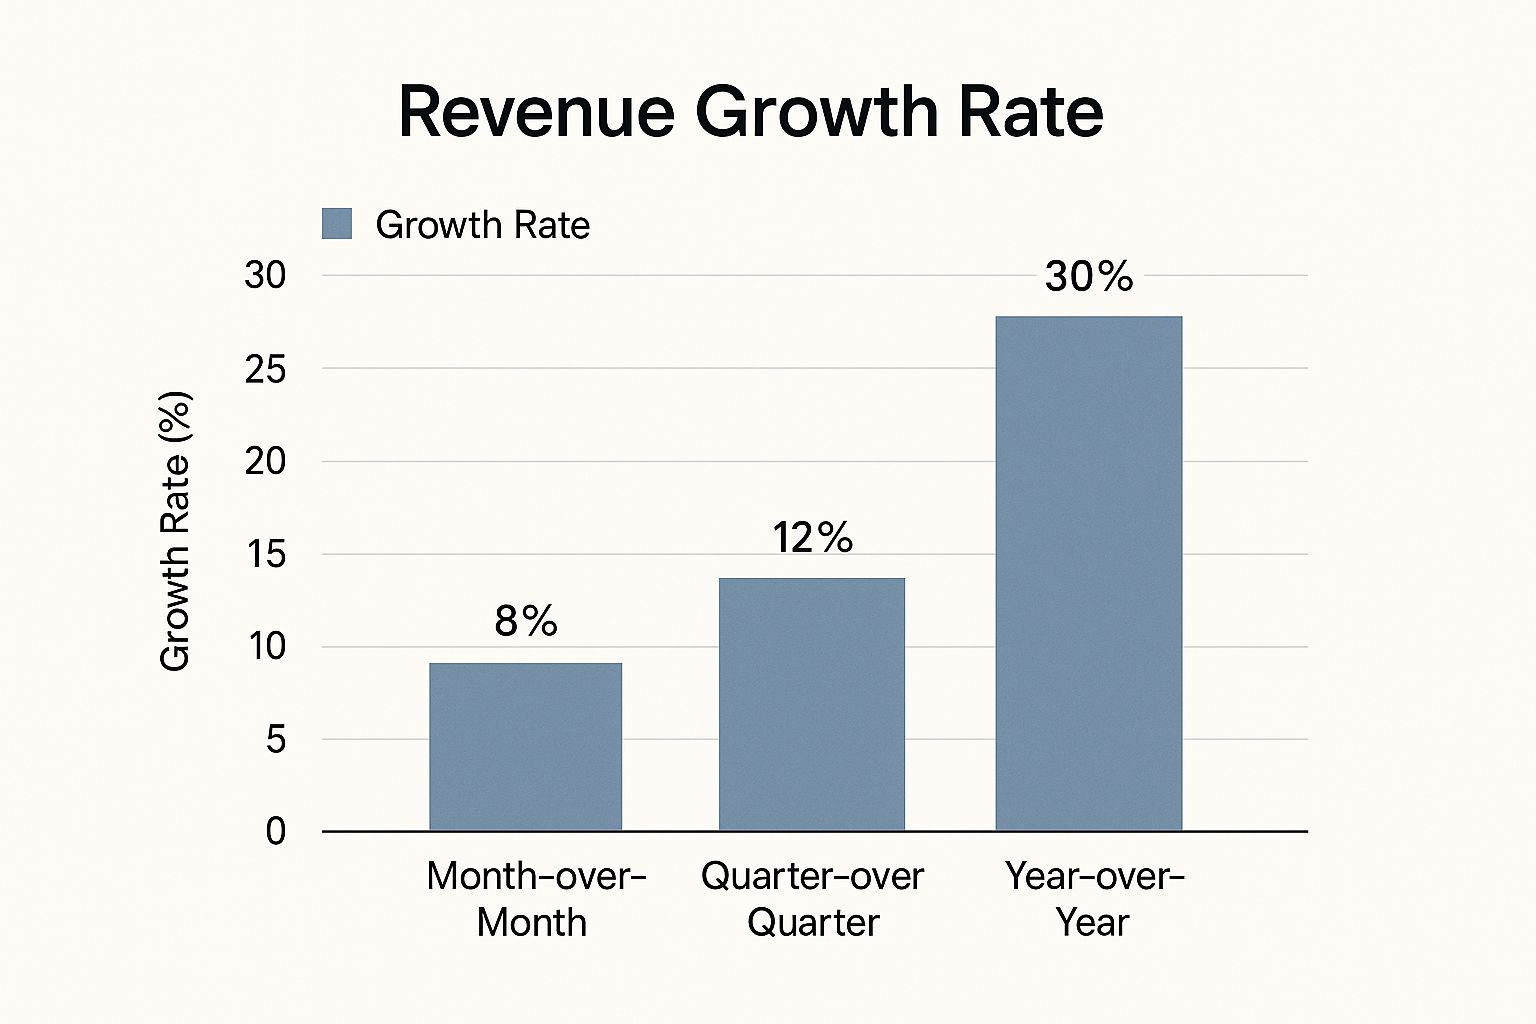
As the chart illustrates, this company experienced 8% growth MoM, 12% growth QoQ, and a significant 30% growth YoY. This data suggests a healthy growth trajectory, with accelerating growth over longer timeframes. While the MoM growth provides a short-term performance snapshot, the YoY figure provides a more comprehensive view of the company's overall success and market penetration. This visualization highlights the importance of analyzing revenue growth across different time horizons to understand underlying trends and make data-driven decisions. By diligently tracking and analyzing this key metric, businesses can gain valuable insights into their sales performance, identify areas for improvement, and ultimately drive sustainable growth.
2. Customer Acquisition Cost (CAC)
Customer Acquisition Cost (CAC) is a critical sales performance metric that represents the total cost a business incurs to acquire a new customer. It encompasses all sales and marketing expenses involved in attracting, converting, and onboarding a customer. Understanding your CAC is essential for evaluating the efficiency of your sales and marketing strategies, optimizing resource allocation, and ultimately, driving sustainable growth. Calculating CAC is straightforward: divide your total sales and marketing costs by the number of new customers acquired during a specific period. This metric provides a clear picture of how much you're spending to gain each new customer, informing critical business decisions related to pricing, budgeting, and growth projections.

CAC deserves a prominent place on any list of essential sales performance metrics examples due to its direct impact on profitability and long-term sustainability. By closely monitoring and optimizing CAC, businesses can ensure they are investing wisely in acquiring customers and maximizing their return on investment. For example, a low CAC indicates efficient sales and marketing processes, while a high CAC suggests potential inefficiencies that need to be addressed. This metric is also foundational for calculating other key metrics like ROI and payback periods, providing a holistic view of sales performance.
Several key features make CAC a powerful metric. First, it incorporates all direct and indirect acquisition costs, including advertising spend, salaries of sales and marketing personnel, the cost of marketing tools and software, and overhead expenses. This provides a comprehensive view of the true cost of customer acquisition. Second, CAC can be segmented by channel, campaign, or customer type, offering granular insights into which acquisition strategies are most cost-effective. For example, you can calculate the CAC for customers acquired through social media marketing separately from those acquired through paid advertising, enabling data-driven optimization. Finally, CAC is essential for pricing and budget allocation decisions. By understanding how much it costs to acquire a customer, businesses can set prices that ensure profitability and allocate budgets effectively across different sales and marketing channels.
The benefits of tracking CAC are numerous. It provides a clear measurement of cost efficiency, allowing businesses to identify and eliminate wasteful spending. It also helps optimize marketing spend allocation by identifying high-performing channels and campaigns with lower CAC. Furthermore, CAC is an essential metric for investor and stakeholder reporting, demonstrating the efficiency of growth strategies. Finally, it enables channel performance comparison, facilitating data-driven decisions about where to invest marketing resources.
However, calculating CAC accurately can be complex. It requires meticulous tracking of all sales and marketing expenses and accurate attribution of new customers to specific channels or campaigns. The cost of acquiring customers can also vary significantly by acquisition channel, making it crucial to analyze CAC by channel to identify the most cost-effective strategies. It’s important to remember that CAC alone doesn't account for customer lifetime value (CLTV). Analyzing CAC in conjunction with CLTV provides a more comprehensive picture of customer profitability. Finally, the timing of expenses versus acquisitions can distort CAC calculations, especially in businesses with long sales cycles.
Successful implementation of CAC analysis can lead to significant improvements in sales performance. HubSpot, for example, reduced its CAC by 50% through inbound marketing optimization. Dropbox achieved a remarkably low CAC through viral referral programs. Salesforce segments its CAC by enterprise versus SMB customers to tailor its acquisition strategies and optimize spending for each segment.
To effectively utilize CAC in your own business, consider the following tips: Track CAC by acquisition channel separately to identify the most efficient channels. Include fully loaded costs, encompassing salaries, tools, and overhead, to get a true picture of acquisition costs. Calculate both blended and paid CAC for a complete understanding of your overall acquisition efficiency. Critically, monitor CAC trends over time, not just point-in-time snapshots, to identify emerging patterns and adjust strategies accordingly.
The concept of CAC has been popularized by SaaS industry pioneers and venture capital firms like Bessemer Venture Partners, highlighting its importance in assessing the viability and scalability of business models. Learn more about Customer Acquisition Cost (CAC) for practical strategies to optimize your acquisition efforts and reduce your CAC. By understanding and actively managing your CAC, you can significantly improve your sales performance, drive sustainable growth, and achieve greater profitability.
3. Customer Lifetime Value (CLV or LTV)
Customer Lifetime Value (CLV or LTV) is a crucial sales performance metric example that goes beyond immediate sales figures and focuses on the long-term value each customer brings to your business. It represents the total revenue you can realistically expect from a single customer throughout their entire relationship with your company. Understanding and leveraging CLV is essential for making data-driven decisions about sales and marketing strategies, particularly customer acquisition costs and retention efforts. This metric provides a powerful lens through which to view your customer base, allowing you to prioritize high-value customers and optimize your resources for maximum return.
How CLV Works:
At its core, CLV calculates the projected revenue a customer will generate over their entire engagement with your business. While various sophisticated models exist, a simplified and commonly used formula is:
CLV = Average Order Value (AOV) × Purchase Frequency × Customer Lifespan
- Average Order Value (AOV): The average amount a customer spends per transaction.
- Purchase Frequency: How often a customer makes a purchase within a given timeframe (e.g., monthly, annually).
- Customer Lifespan: The average length of time a customer remains a paying customer.
This formula provides a baseline CLV calculation. More complex models incorporate factors like customer churn rate, discount rates, and the cost of goods sold (COGS) for a more granular and accurate prediction.
Why CLV Deserves Its Place in the List:
CLV is a cornerstone of strategic sales and marketing planning because it shifts the focus from short-term wins to long-term profitability. It provides valuable insights that inform critical business decisions, including:
- Justifying Customer Acquisition Costs (CAC): CLV helps determine how much you can afford to spend on acquiring new customers. A healthy business model ensures that CLV significantly exceeds CAC.
- Identifying High-Value Customer Segments: By segmenting CLV by demographics, behavior, or acquisition channel, you can pinpoint your most valuable customers and tailor strategies to attract and retain them.
- Developing Effective Retention Strategies: Understanding CLV highlights the importance of customer retention. Investing in strategies to increase customer lifespan and purchase frequency directly impacts overall revenue.
- Optimizing Marketing Spend: CLV informs personalized marketing approaches. By understanding the potential value of each customer segment, you can allocate marketing resources more effectively.
- Predictive Revenue Planning: CLV facilitates long-term revenue forecasting, allowing you to make informed decisions about future investments and growth strategies.
Examples of Successful CLV Implementation:
- Amazon: Amazon leverages CLV to justify the cost of acquiring Prime members, recognizing the higher purchase frequency and lifetime value of Prime subscribers compared to non-members.
- Starbucks: Starbucks segments CLV by rewards program participation, understanding that rewards members tend to have higher purchase frequency and lifetime value, enabling targeted promotions and personalized offers.
- Netflix: Netflix calculates CLV based on subscription duration and engagement metrics like viewing hours. This helps them understand the value of different content offerings and personalize recommendations to increase customer retention.
Actionable Tips for Using CLV:
- Use Cohort Analysis: Analyze groups of customers acquired within the same timeframe (cohorts) to gain a more accurate understanding of CLV trends over time.
- Regularly Update CLV Models: Customer behavior and market conditions change. Regularly update your CLV models with fresh data to ensure accuracy.
- Segment by Acquisition Channel: Analyze CLV by acquisition channel (e.g., social media, email marketing) to optimize your marketing spend and prioritize high-performing channels.
- Focus on Retention and Upselling: Prioritize strategies that increase customer lifespan and purchase frequency, such as loyalty programs, personalized recommendations, and exceptional customer service.
Pros and Cons of Using CLV:
Pros:
- Justifies customer acquisition investments
- Identifies most valuable customer segments
- Supports retention strategy development
- Enables personalized marketing approaches
- Predictive metric for long-term revenue planning
Cons:
- Requires accurate historical data
- Can be complex to calculate for new businesses
- May not account for changing customer behavior
- Predictions can be inaccurate in volatile markets
By incorporating CLV into your sales performance analysis, you gain a powerful tool for understanding the long-term value of your customers and making strategic decisions that drive sustainable growth. For sales professionals, understanding CLV provides the justification for investing in customer relationships and focusing on long-term value creation rather than just short-term sales wins. For larger teams and organizations, CLV offers a critical metric for resource allocation and strategic planning.
4. Sales Conversion Rate
Sales Conversion Rate is a critical sales performance metric that measures the percentage of prospects who complete a desired action, typically making a purchase. It provides a clear picture of how effectively your sales process turns potential customers into paying customers. Calculated as (Number of Conversions / Total Number of Visitors or Leads) × 100, this metric is essential for understanding sales effectiveness and identifying areas for optimization throughout the sales funnel. A high conversion rate signifies a strong sales process, while a low rate indicates areas needing improvement. This metric is invaluable for data-driven decision-making, allowing businesses to refine their strategies and maximize revenue generation.

One of the most powerful features of the Sales Conversion Rate is its versatility. It's measurable at multiple stages of the sales funnel, from initial contact to final purchase. This granular approach allows you to pinpoint specific bottlenecks hindering your sales performance. For example, you can track conversion rates from lead to opportunity, opportunity to proposal, and proposal to close. Furthermore, it's applicable across various sales channels, including online, offline, email marketing, and social media. This cross-channel applicability provides a holistic view of your sales performance across all customer touchpoints. Finally, segmenting conversion rates by traffic source, product, or time period allows for in-depth analysis and targeted optimizations. For instance, identifying a low conversion rate from a specific traffic source may indicate a mismatch between the source and your target audience.
This metric’s impact on revenue is direct and significant. Unlike metrics that focus on activity, Sales Conversion Rate directly correlates to revenue growth. Improving your conversion rate means you're generating more sales from the existing traffic or leads, without necessarily increasing your marketing spend. This makes it a highly efficient way to boost revenue.
Pros of Tracking Sales Conversion Rate:
- Immediate indicator of sales process effectiveness: A drop in conversion rate quickly signals a problem in the sales process.
- Relatively easy to track and measure: With the right tools, tracking conversion rates is straightforward.
- Improvements directly increase revenue: Optimizations that boost conversion rates translate directly to higher revenue.
- Helps identify specific bottlenecks in sales process: By analyzing conversion rates at each stage, you can pinpoint weaknesses.
Cons of Relying Solely on Sales Conversion Rate:
- Doesn't account for deal size variations: A high conversion rate with small deal sizes might not be as profitable as a lower rate with larger deals.
- May not reflect long-term customer value: Focusing solely on initial conversions may overlook customer lifetime value.
- Can be manipulated by changing lead qualification criteria: Tightening lead qualification can artificially inflate conversion rates.
- Industry variations make benchmarking challenging: Comparing conversion rates across different industries can be misleading.
Examples of Successful Implementation:
- E-commerce giants like Amazon continuously optimize their checkout conversion rates through A/B testing and user experience enhancements.
- Shopify stores, on average, achieve e-commerce conversion rates between 2-3%, with top performers exceeding these benchmarks.
- B2B SaaS companies closely track trial-to-paid conversion rates to measure the effectiveness of their onboarding and product adoption strategies.
Tips for Improving Sales Conversion Rates:
- Track conversion rates at each funnel stage: Identify specific drop-off points and focus on improving those areas.
- A/B test different elements to improve rates: Experiment with different calls to action, landing page designs, and email subject lines.
- Segment conversion rates by traffic source: Tailor your messaging and offers to different audience segments.
- Focus on qualified leads rather than just volume: Prioritize attracting high-quality leads who are more likely to convert.
When should you use this approach? The Sales Conversion Rate is a fundamental metric for any business that wants to understand and improve its sales performance. Whether you're a solo sales professional, part of a small-to-medium sized B2B sales team, a marketing agency, or an enterprise organization, tracking and analyzing your Sales Conversion Rate is crucial for sustainable growth. For a deeper dive into improving your sales conversion rates, Learn more about Sales Conversion Rate. By focusing on optimizing this key metric, you can drive revenue growth and maximize the return on your sales and marketing efforts.
5. Average Deal Size (ADS)
Average Deal Size (ADS), a crucial sales performance metric, represents the average monetary value of closed sales deals over a specific period. It provides valuable insights into the revenue generated per transaction, moving beyond sheer sales volume to assess the quality of those sales. Calculated as Total Revenue / Number of Deals Closed, ADS is a powerful tool for forecasting, quota setting, sales strategy development, and understanding overall business health. Its inclusion in any suite of sales performance metrics examples is essential for data-driven decision-making.
This metric goes beyond simply counting the number of deals closed. It dives deeper to reveal the average value of each successful transaction. Understanding your ADS allows you to paint a clearer picture of revenue streams and identify potential areas for improvement within the sales process. Whether you’re a solo sales professional, part of a small-to-medium-sized B2B sales team, or managing a large enterprise organization, tracking ADS can significantly impact your bottom line.
How ADS Works and Why It Matters
Calculating ADS is straightforward. Let's say your company generated $500,000 in revenue last quarter by closing 50 deals. Your ADS would be $10,000. This figure provides a benchmark for evaluating the value of your sales efforts. A higher ADS suggests stronger revenue generation per transaction, impacting profitability and resource allocation.
Tracking ADS over time reveals trends in customer behavior, pricing strategies, and product performance. For example, a consistently increasing ADS could indicate the success of upselling/cross-selling initiatives or premium pricing strategies. Conversely, a declining ADS might signal a shift in customer preferences, increased competition, or the need to re-evaluate pricing models.
Features and Benefits of Tracking ADS
ADS offers a multifaceted view of sales performance. It:
- Tracks Revenue Quality Alongside Quantity: It isn’t just about how many deals you close; it's about the value of those deals.
- Enables Segmented Analysis: ADS can be broken down by sales representative, product, customer segment, or time period to pinpoint areas of strength and weakness.
- Measures Upselling/Cross-selling Effectiveness: A rising ADS can indicate the success of strategies aimed at increasing the value of each transaction.
- Identifies Market Segment Preferences: Analyzing ADS across different customer segments reveals varying purchasing behaviors and price sensitivities.
- Supports Forecasting and Planning: ADS plays a critical role in accurately projecting future revenue and setting realistic sales quotas.
Pros and Cons of Using ADS
Pros:
- Simple Calculation, Clear Impact: Easy to calculate and provides direct insight into revenue performance.
- Useful for Forecasting and Planning: Enables accurate revenue projections and informed resource allocation.
- Indicates Premium Pricing Success: Tracks the effectiveness of strategies aimed at higher price points.
- Optimizes Sales Focus: Helps prioritize efforts on high-value deals and customer segments.
Cons:
- Susceptible to Outlier Distortion: Extremely large or small deals can skew the average, providing a misleading picture.
- Doesn't Reflect Sales Velocity: ADS doesn't reveal how quickly deals are closing, a crucial aspect of sales performance.
- May Mask Underlying Changes: A stable ADS might hide shifts in customer segments or product preferences.
- Seasonal Variations: Seasonal buying patterns can create fluctuations in ADS, making trend analysis challenging.
Examples of Successful Implementation
- Salesforce: Tracks ADS across different product lines to understand which products contribute most significantly to revenue.
- Real Estate: Monitors average home sale prices to assess market trends and adjust pricing strategies.
- SaaS Companies: Analyze average contract values by customer size to tailor pricing and service offerings.
Actionable Tips for Using ADS
- Use Median Alongside Average: Calculate the median deal size to mitigate the impact of outliers on the average.
- Segment ADS: Break down ADS by customer type, product category, and sales rep to uncover granular insights.
- Track Trends Over Time: Focus on ADS trends over time rather than single data points to identify patterns and understand performance changes.
- Correlate ADS with Sales Strategies: Analyze how changes in sales strategies impact ADS to optimize your approach.
By understanding and actively monitoring Average Deal Size, businesses gain a crucial edge in evaluating sales performance, optimizing strategies, and ultimately driving revenue growth. This metric is an invaluable tool for anyone involved in sales, from individual freelancers to enterprise sales teams, providing the insights necessary to make informed decisions and achieve success in a competitive market.
6. Sales Cycle Length: A Critical Sales Performance Metric
Sales cycle length is a crucial sales performance metric that measures the average time it takes to close a deal, from the initial contact with a prospect to the final purchase. Understanding and optimizing this metric is essential for effective sales forecasting, resource allocation, and overall business success. This is especially true in B2B environments, where sales processes are often complex and involve multiple stakeholders. Including sales cycle length in your arsenal of sales performance metrics examples provides valuable insight into your sales team's effectiveness and overall business health.
Calculating sales cycle length is relatively straightforward: Total Days from First Contact to Close / Number of Deals. However, the nuances of this metric lie in its interpretation and application.
Understanding the Nuances of Sales Cycle Length
While the formula is simple, sales cycle length can vary significantly based on several factors. Industry, deal complexity, and even the specific starting point within the sales funnel all influence the overall duration. For example, enterprise software sales cycles often range from 6-18 months, while real estate transactions typically close within 30-45 days. Understanding these variances is crucial for accurate benchmarking and performance evaluation.
Furthermore, sales cycle length has a direct impact on cash flow and resource planning. Longer sales cycles require more sustained effort and resources, potentially impacting profitability. This is why accurately measuring and managing sales cycle length is paramount, particularly for small-to-medium sized businesses and freelancers who need to optimize their resources carefully.
The Advantages of Tracking Sales Cycle Length
Monitoring sales cycle length provides a number of significant benefits:
- Accurate Sales Forecasting: Knowing the average time it takes to close deals enables more precise revenue projections and informs strategic decision-making.
- Process Inefficiency Identification: Analyzing sales cycle length can highlight bottlenecks and inefficiencies in the sales process, allowing for targeted improvements. For instance, HubSpot famously reduced its average sales cycle through better lead qualification.
- Sales Team Capacity Planning: Understanding sales cycle length helps in determining the optimal team size and resource allocation to manage the pipeline effectively.
- Improved Customer Expectation Management: A clear understanding of the sales cycle enables sales teams to set realistic expectations with potential clients, fostering trust and transparency throughout the process.
Challenges in Measuring Sales Cycle Length
While highly beneficial, tracking sales cycle length isn't without its challenges:
- Deal-to-Deal Variability: The time to close can fluctuate significantly between individual deals, making it challenging to establish a consistent baseline.
- External Factors: Economic conditions, competitor activities, and other external influences can impact sales cycle length, making it difficult to isolate internal performance factors.
- Cross-Industry Benchmarking: Comparing sales cycle length across different industries can be misleading due to inherent variations in sales processes and customer behavior.
- Optimization Complexity: Optimizing long and complex sales cycles can be a challenging undertaking, requiring careful analysis and strategic adjustments to the sales process.
Actionable Tips for Optimizing Sales Cycle Length
Here are some practical tips to help you effectively manage and shorten your sales cycle length:
- Segment and Track: Track cycle length by deal size, product type, and customer segment to identify trends and areas for improvement.
- Streamline Your Process: Identify and eliminate unnecessary steps in your sales process. Learn more about Sales Cycle Length.
- Leverage CRM Data: Utilize CRM data to accurately measure touchpoints and identify bottlenecks in the customer journey.
- Monitor Close Rates: Track how changes in sales cycle length affect close rates to understand the impact of optimization efforts.
By incorporating sales cycle length as a key performance indicator and implementing these strategies, sales teams, from solo freelancers to enterprise organizations, can gain valuable insights, improve sales performance, and drive revenue growth. This metric deserves a prominent place in your sales performance metrics examples as it offers a direct link to understanding and optimizing your sales efficiency and ultimately, your bottom line.
7. Sales Activity Metrics
Sales activity metrics are crucial sales performance metrics examples that provide a window into the daily efforts of your sales team. They track the quantity and quality of sales-related activities performed by sales representatives, offering valuable insights into their workflows and effectiveness. These metrics are considered leading indicators, meaning they help predict future sales performance and identify areas for improvement before problems significantly impact revenue. Tracking activities such as calls made, emails sent, meetings scheduled, presentations delivered, and proposals submitted allows sales managers to monitor progress, identify best practices, and coach team members towards achieving their targets. This makes them essential for any sales team, from solo freelancers to large enterprises.
Sales activity metrics are particularly valuable because they offer a granular view of the sales process. Unlike lagging indicators like revenue, which reflect past performance, activity metrics provide real-time data that can be used to proactively manage sales efforts. By monitoring these metrics, managers can quickly identify potential roadblocks, adjust strategies, and provide targeted coaching to improve individual and team performance. For example, if a sales rep is consistently making a high volume of calls but scheduling very few meetings, this could indicate a problem with their call approach or lead qualification process. Addressing this issue early can prevent lost opportunities and improve overall sales results.
How Sales Activity Metrics Work:
Tracking sales activity metrics typically involves using a Customer Relationship Management (CRM) system. Modern CRMs like Salesforce, HubSpot, and Zoho CRM automate the tracking process, recording every call, email, meeting, and other relevant activity. This eliminates the need for manual data entry and ensures accuracy. Some CRMs also offer advanced features like activity scoring and benchmarking, which provide a more nuanced understanding of performance. For example, Outreach.io assigns scores based on the engagement level of each activity, allowing sales managers to identify which activities are most effective in moving deals forward. Even simpler tools like spreadsheets can be used, though they require more manual input and are less scalable.
Examples of Successful Implementation:
- Salesforce: A software company uses Salesforce to track calls, emails, and meeting completion rates. By analyzing this data, they identified that their top performers consistently scheduled more product demos than their lower-performing colleagues. They then implemented a coaching program focused on improving demo scheduling techniques, resulting in a significant increase in overall sales.
- Outreach.io: A marketing agency uses Outreach.io to track and benchmark email open rates, click-through rates, and response rates. By comparing the performance of individual team members, they were able to identify best practices for email outreach and implement them across the entire team. This led to a significant improvement in lead generation and conversion rates.
- Insurance Company: An insurance company tracks the quote-to-application ratio for their sales agents. This metric helps them identify agents who are effectively converting quotes into actual policies and those who are struggling with the closing process. Targeted training and coaching programs are then implemented to improve closing rates.
Actionable Tips for Using Sales Activity Metrics:
- Balance Quantity with Quality: While a high volume of activity can be positive, it’s essential to also focus on the quality of those activities. Track metrics like conversion rates, deal size, and customer satisfaction to ensure that activity translates into meaningful results.
- Set Activity Benchmarks: Analyze the performance of your top performers to establish realistic and achievable activity benchmarks for the rest of the team. These benchmarks should be specific and measurable, such as "schedule 10 qualified demos per week" or "send 20 personalized follow-up emails per day."
- Use Activity Ratios: Tracking ratios like calls to meetings, meetings to proposals, and proposals to closed deals can provide valuable insights into the effectiveness of each stage of the sales process.
- Correlate Activities with Sales Outcomes: Don’t just track activities in isolation. Analyze the relationship between sales activities and actual sales results to understand which activities are most impactful in driving revenue.
- Regularly Review and Adjust: Sales activity metrics should be reviewed regularly, at least weekly or monthly. Use this data to identify trends, adjust sales strategies, and provide ongoing coaching and support to your sales team.
Pros and Cons of Using Sales Activity Metrics:
Pros:
- Provides early warning signals for performance issues.
- Enables proactive sales management.
- Helps identify best practices for replication.
- Supports individual sales rep coaching.
Cons:
- Quantity doesn't always equal quality.
- Can encourage gaming or manipulation if not managed carefully.
- May not directly correlate with results in all cases.
- Requires consistent tracking and management.
Sales activity metrics are invaluable for understanding the day-to-day efforts of your sales team and predicting future performance. By implementing these sales performance metrics examples, and using the tips provided, you can gain valuable insights into your sales process, identify areas for improvement, and ultimately drive revenue growth. Remember, the goal is not just to track activity for activity’s sake, but to use this data to optimize your sales strategy and empower your team to achieve their full potential.
7 Sales Performance Metrics Comparison
| Metric | Implementation Complexity 🔄 | Resource Requirements ⚡ | Expected Outcomes 📊 | Ideal Use Cases 💡 | Key Advantages ⭐ |
|---|---|---|---|---|---|
| Revenue Growth Rate | Low – simple calculation, some seasonal adjustment | Moderate – data collection across periods | Measures overall business health and market demand | Forecasting, stakeholder reporting, sales effectiveness | Easy to understand, directly correlates with business success |
| Customer Acquisition Cost (CAC) | Medium – requires tracking all sales & marketing costs | High – involves comprehensive cost accounting | Efficiency of acquiring new customers, ROI insights | Marketing optimization, budgeting, channel analysis | Clear cost efficiency measurement, aids budget allocation |
| Customer Lifetime Value (CLV) | High – predictive models and historical data needed | High – requires detailed customer data and analysis | Long-term revenue prediction and ROI justification | Retention strategies, personalized marketing | Identifies valuable segments, supports acquisition spend justification |
| Sales Conversion Rate | Low – simple percentage calculation | Low – tracking leads and conversions | Measures sales effectiveness, identifies funnel bottlenecks | Funnel optimization, sales performance tracking | Quick feedback on sales processes, easy to measure |
| Average Deal Size (ADS) | Low – straightforward revenue per deal calculation | Moderate – sales data aggregation | Understands revenue per transaction trends | Forecasting, quota setting, sales strategy | Indicates quality of sales, useful for premium pricing strategies |
| Sales Cycle Length | Medium – tracking time from contact to close | Moderate – requires accurate CRM data | Improves forecasting and resource allocation | Complex B2B sales, cash flow management | Identifies inefficiencies, aids expectation management |
| Sales Activity Metrics | Medium – requires consistent activity tracking | High – CRM automation and reporting | Early indicators of sales performance and coaching needs | Sales team management, performance improvement | Enables proactive management, tracks leading indicators |
Driving Sales Performance with Salesloop.io
This article has explored a range of crucial sales performance metrics examples, from revenue growth rate and customer acquisition cost (CAC) to sales conversion rate and average deal size (ADS). Understanding these metrics, including customer lifetime value (CLV or LTV) and sales cycle length, is fundamental for any sales organization aiming to optimize its processes and drive sustainable growth. By effectively tracking and analyzing these key performance indicators (KPIs), alongside your essential sales activity metrics, you can identify areas for improvement, make data-driven decisions, and ultimately boost your bottom line. Mastering these concepts empowers you to accurately measure your sales team's effectiveness, forecast future performance, and implement strategies for continuous improvement.
For solo sales professionals, freelancers, SMBs, and enterprise organizations alike, having a robust system for tracking and analyzing these metrics is no longer a luxury, but a necessity. Whether you're a marketing agency refining lead generation strategies or a sales operations manager seeking to improve team performance, leveraging these metrics is essential for success. The insights gleaned from these data points provide a clear path towards increased efficiency, higher conversion rates, and greater profitability.
Ready to take your sales performance to the next level? Salesloop.io offers a comprehensive platform that automates your sales outreach and seamlessly tracks the key sales performance metrics examples discussed in this article. Visit Salesloop.io today to explore our flexible pricing plans and discover how we can help you achieve your sales goals. Request a personalized demo and see firsthand how Salesloop.io can transform your sales performance tracking and analysis.

Sales KPI Dashboard Mastery: Transform Team Performance