
Why Sales KPI Dashboards Transform Team Performance

Sales teams constantly aim for better performance and ambitious targets. A sales KPI dashboard has become essential for modern sales teams looking to reach their full potential. This means sales leaders must understand not only what a sales KPI dashboard is, but why it's vital for growth and transforming team performance.
Imagine a sales team using only spreadsheets and static reports. This process can be slow, difficult, and prone to errors. Important insights might be hidden within complex data, slowing the team's response to market changes. A sales KPI dashboard, however, puts all key metrics in one place, giving a clear performance overview.
Benefits of a Sales KPI Dashboard
A well-designed sales KPI dashboard offers many advantages:
- Real-time visibility: Sales leaders can quickly see strengths and weaknesses.
- Data-driven decision making: Decisions are based on hard data, not guesswork.
- Improved team collaboration: Dashboards create transparency and accountability, aligning the team toward shared goals.
- Enhanced forecasting accuracy: Tracking historical trends allows for better revenue predictions.
- Proactive strategy adjustments: Instant insights allow sales leaders to adapt strategies quickly.
This shift from reactive management to proactive strategy is vital in a competitive market. A sales KPI dashboard gives teams the tools to anticipate challenges and seize opportunities. Using KPI dashboards has changed how sales teams analyze and use data. By 2025, businesses heavily rely on these dashboards to track key performance indicators (KPIs) for fast insights and data-driven decisions. Learn more about KPI Dashboards
One trend is integrating KPIs like Monthly Sales Growth and Average Profit Margin into these dashboards. For example, a company might target a 15% annual increase in monthly sales growth, using a KPI dashboard to track progress and adjust strategies.
From Chaos to Clarity: The Impact on Sales Culture
A sales KPI dashboard can significantly change sales culture, shifting from gut decisions to data-backed strategies. This encourages accountability and a more analytical, performance-driven approach. By visualizing progress and celebrating wins, dashboards can also boost team morale.
But a dashboard is only as good as its data. Choosing the right KPIs and presenting them clearly is crucial for maximum impact. A cluttered or poorly designed dashboard can be overwhelming and unhelpful.
Key Considerations for Effective Dashboards
Building a strong sales KPI dashboard requires careful planning. Consider these key elements:
- Identify your key objectives: What do you want your dashboard to achieve?
- Choose relevant KPIs: Which metrics offer the most useful insights?
- Select the right platform: Which dashboard software best suits your needs?
- Design for clarity and usability: Ensure your dashboard is easy to use and understand.
By focusing on these elements, you can build a sales KPI dashboard that truly transforms team performance and boosts revenue growth. A well-designed dashboard becomes a powerful tool, not just for tracking performance, but for creating a data-driven culture of continuous improvement. This allows teams to not only hit their targets, but consistently surpass them.
Essential KPIs That Actually Drive Revenue Growth
Not all metrics are created equal. A vanity metric might look impressive on a report, but does it truly impact your bottom line? For a sales KPI dashboard to genuinely fuel revenue growth, it must focus on metrics directly correlated with sales performance. This visualized sales dashboard demonstrates how to present crucial metrics like conversion rate, average deal size, and revenue trends for quick, actionable insights.
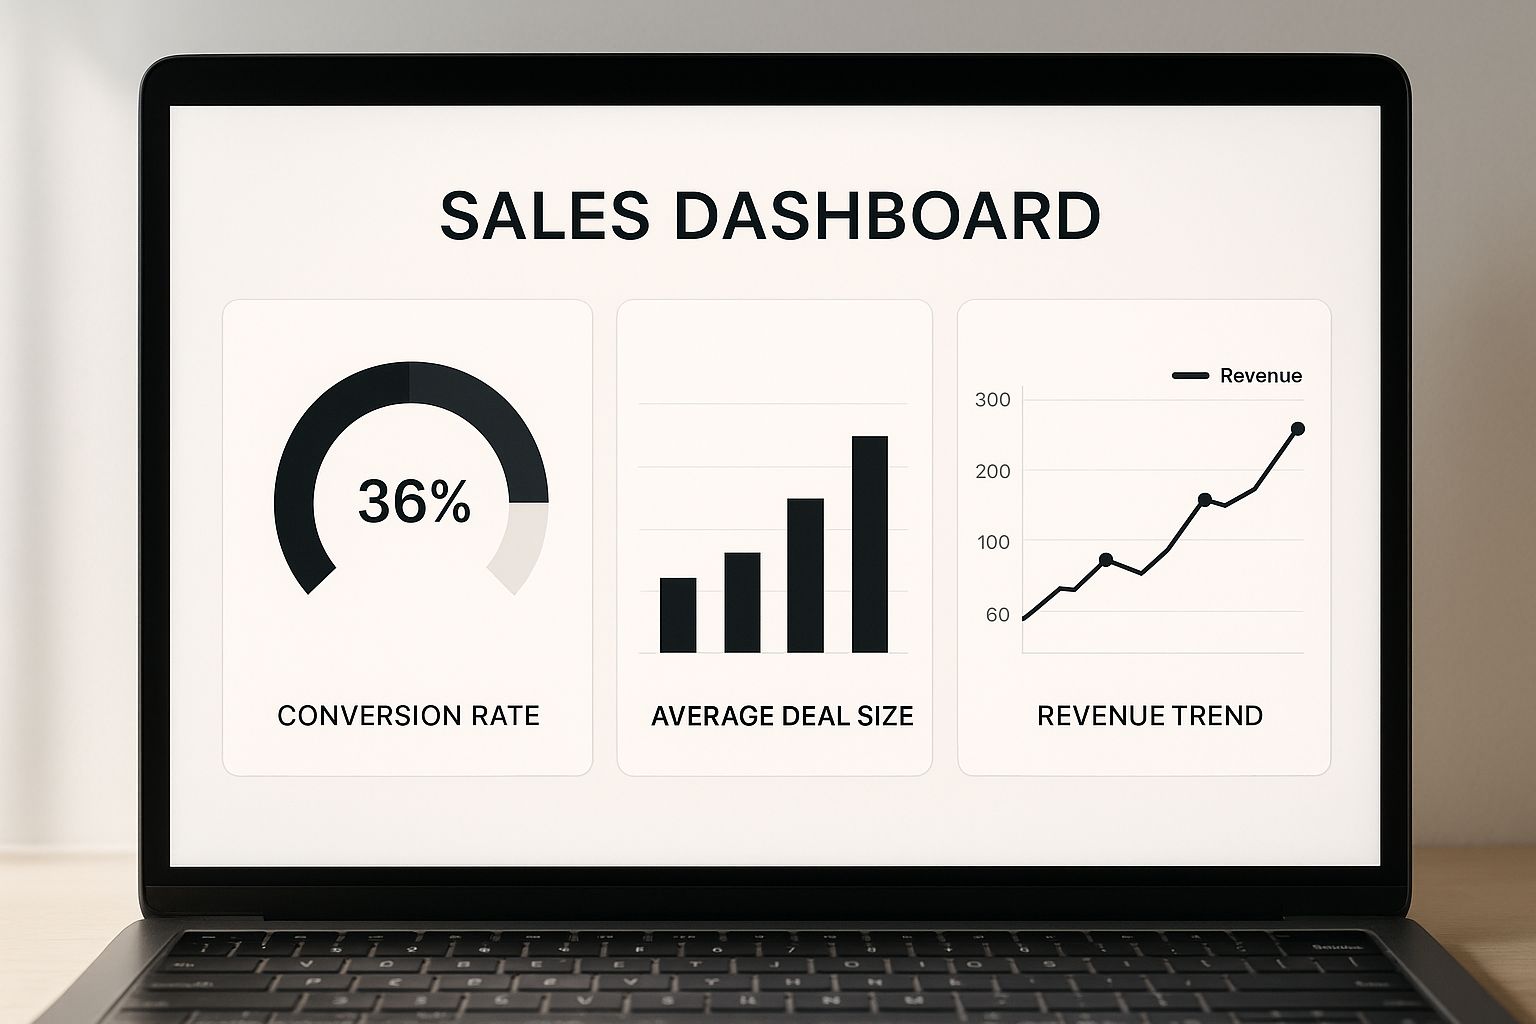
This infographic emphasizes the importance of visually tracking these key performance indicators. Consistent monitoring allows sales teams to identify areas for improvement and adjust strategies for optimal results. This data-driven approach leads to more accurate revenue forecasting and, ultimately, stronger performance.
Key Revenue Drivers: Win Rate, Deal Velocity, and Conversion Percentages
An effective sales KPI dashboard prioritizes actionable metrics. This includes indicators like win rate, the percentage of closed-won deals. Win rate reveals your team's effectiveness in closing deals already in the pipeline. Deal velocity, the time it takes to move a deal through your sales process, is another crucial metric. Faster velocity often translates to quicker revenue generation. Equally vital are conversion percentages, which track lead progression through each stage of your sales funnel. Understanding where leads drop off illuminates areas for improvement.
These core KPIs reveal the efficiency and effectiveness of your sales process, enabling you to pinpoint bottlenecks and optimize your strategies. Implementing structured sales KPIs, such as win rate, yields significant benefits. A benchmark win rate for B2B sales teams is typically between 20-30%. This indicates a strong competitive position and efficient sales process. Companies can use this metric to evaluate their current sales strategies and make data-backed adjustments to improve their conversion rates. For more in-depth information on this topic, visit Forecastio. You might also find this resource helpful: How to master B2B sales lead generation.
Setting Realistic Benchmarks and Targets
Tracking metrics alone is insufficient. Understanding what constitutes "good" performance requires establishing realistic benchmarks and targets. While industry averages provide a starting point, consider your unique business model and specific sales goals. Overly ambitious targets can demotivate your team, while targets set too low fail to drive substantial growth.
Understanding KPI Relationships and Avoiding Vanity Metrics
Understanding the interplay between different KPIs is also critical. For instance, a high win rate coupled with low deal velocity might suggest your team is focusing on the wrong opportunities. It's essential to avoid vanity metrics – metrics that appear impressive but lack actionable insights. While website visits might seem relevant, prioritizing lead quality and conversion rates provides more effective direction.
The following table summarizes essential sales KPIs and typical industry benchmarks to help you set realistic goals and optimize your sales performance:
Essential Sales KPIs and Industry Benchmarks
Key performance indicators with typical benchmark ranges for B2B sales teams
| KPI | Description | Industry Benchmark | Frequency |
|---|---|---|---|
| Win Rate | Percentage of closed-won opportunities | 20-30% | Monthly/Quarterly |
| Deal Velocity | Time taken to move a deal through the sales pipeline | Varies based on industry and sales cycle | Weekly/Monthly |
| Conversion Rate | Percentage of leads converting to opportunities | 1-3% (Marketing Qualified Leads to Sales Qualified Leads) | Weekly/Monthly |
| Average Deal Size | Average value of closed-won deals | Varies based on product/service pricing | Monthly/Quarterly |
| Customer Lifetime Value (CLTV) | Predicted total revenue from a customer over their relationship with the company | Varies significantly across industries | Annually |
This table provides a quick reference for common sales KPIs and their benchmarks. Remember to adapt these benchmarks to your specific business context and target market.
Aligning KPIs with Business Objectives
Your dashboard KPIs should directly align with your overarching business objectives. Are you aiming for increased market share, higher customer lifetime value, or accelerated growth? Your chosen KPIs should reflect these goals, providing the data necessary to measure progress and make informed decisions. By connecting your dashboard to your overall strategy, you create a powerful engine for driving revenue growth and achieving sustained success.
Building Your Dashboard From Concept To Implementation
So, you're ready to build a sales KPI dashboard that truly makes a difference? Creating a functional dashboard that your team actually uses involves some crucial technical and strategic choices. This guide will walk you through the process, ensuring your sales command center delivers real, tangible results. For a deeper dive into sales strategies, check out our guide on How to master your inbound sales funnel.
Defining Your Dashboard's Purpose and Scope
Before getting into the design, you need to clearly define the purpose of your dashboard. What are the most important questions you need it to answer? Is the goal to boost sales performance, track marketing campaign effectiveness, or perhaps gain a more comprehensive business overview? Clearly defining the scope prevents unnecessary features and ensures the final product remains focused and easy to use.
Selecting the Right KPIs
The success of your dashboard depends heavily on choosing the right Key Performance Indicators. These KPIs should directly relate to your pre-defined goals. For instance, if you're looking to shorten the sales cycle, deal velocity is a critical metric. If lead generation is the focus, then conversion rates become paramount. Prioritize metrics that offer actionable insights over vanity metrics.
Choosing the Right Dashboard Platform
There are many dashboard platforms available, each with its own set of advantages and disadvantages. Popular choices include Klipfolio, Geckoboard, and Tableau. When making your selection, consider factors like data integration capabilities, customization options, and ease of use. Seamless integration with your current CRM and marketing automation systems is also essential.
Designing for Clarity and Usability
A cluttered dashboard can quickly overwhelm users and decrease its overall value. Design with clarity and usability in mind. Organize metrics logically using visual cues such as color-coding and clear labels. Keep the layout clean and intuitive, prioritizing the most essential information. Think of your dashboard as a storytelling tool, guiding users through the data narrative.
Implementing Data Accuracy and Automation
Data integrity is key. Establish clear processes to ensure data accuracy and consistency. This could include automated data feeds from your CRM or regular data validation checks. Automating data updates saves time and minimizes the risk of human error, allowing your team to focus on analyzing insights rather than manual data entry.
Gathering User Feedback and Iterating
Launching your dashboard isn't the end; it's just the beginning. Gather feedback from your sales team to pinpoint areas for improvement. Are they finding the information they need quickly? Are the visualizations effective? Regularly review and refine your dashboard based on this feedback, ensuring it continues to evolve alongside your business needs. This iterative process encourages team adoption and maximizes the dashboard's impact on your sales performance.
Breaking Down Silos Through Unified Dashboard Strategy
Collaboration is essential for any successful organization. But achieving true collaboration can be difficult. How do you break down those departmental barriers and ensure everyone is moving towards the same objectives? A unified sales KPI dashboard strategy might be the answer. It provides a central hub for sales, marketing, and leadership to access the vital data they need, aligning everyone towards shared goals.
Fostering Collaboration and Enhanced Decision-Making
Centralized dashboards effectively eliminate data silos, those pockets of information that hinder collaboration. This unified visibility empowers teams to make informed decisions based on a shared understanding of performance. Marketing can see the direct impact of their campaigns on sales pipeline growth. Sales gains valuable insights into which marketing efforts generate the highest quality leads.
This transparency also extends to leadership, providing a clear overview of overall business performance. Furthermore, adopting KPI dashboards plays a crucial role in team alignment. Centralization breaks down data silos, fostering collaboration and enhancing the decision-making process. Companies are increasingly using KPIs to track costs like Cost Per Impression (CPI) and Return on Investment (ROI), potentially reducing costs by 10-20%. Find more detailed statistics here.
Overcoming Stakeholder Challenges and Conflicting Metrics
Gaining buy-in from different stakeholders can be tricky. Different departments often have competing priorities and varying metric preferences. The key is to create dashboard views tailored to specific team needs while still maintaining a focus on overall business goals. This allows each team to see the data relevant to them, while also understanding how their work contributes to the bigger picture.
Integrating Cross-Functional Metrics Without Creating Dashboard Chaos
Integrating cross-functional metrics without creating an overwhelming, cluttered mess requires strategic organization. Group related KPIs together, use clear and concise labels, and employ visual cues such as color-coding to guide users through the data. Avoid overcrowding the dashboard with too many metrics. Instead, prioritize the most critical indicators that directly contribute to business success.
Establishing Shared Accountability and Collaborative Success
A unified sales KPI dashboard cultivates a sense of shared accountability. When everyone has access to the same data and understands how their individual performance affects the overall picture, a sense of collective ownership emerges. This shared responsibility drives collaborative success, shifting the focus from individual departmental achievements to shared business objectives.
Handling Political Challenges Around Data Ownership
Data ownership can sometimes create political challenges within an organization. A unified dashboard strategy needs clear guidelines regarding data access and responsibilities. Transparency is paramount. Everyone should understand how data is collected, analyzed, and ultimately used. This open approach helps minimize potential conflicts and fosters trust.
Maintaining Focus on Collaborative Metrics
The ultimate goal is to focus on metrics that drive collaborative success, not just individual departmental performance. While departmental KPIs have their place, emphasizing metrics that demonstrate the combined impact of sales and marketing efforts is key. For example, tracking revenue generated from marketing-qualified leads showcases the tangible value of cross-functional collaboration. By prioritizing these shared metrics, you reinforce the power of teamwork in achieving overall business success.
Advanced Features That Deliver Competitive Advantage
Moving beyond basic reporting is essential for achieving a true competitive edge. A sales KPI dashboard should be more than just a data display; it needs to provide actionable insights that empower your team to make proactive, data-driven decisions. This means integrating advanced features that transform raw data into predictive intelligence.
Trend Analysis and Forecasting
Imagine having a tool that predicts future sales performance. Trend analysis offers this predictive power. By analyzing historical data, your sales KPI dashboard can identify developing patterns and project future outcomes. This foresight allows you to adjust sales strategies proactively, anticipate potential roadblocks, and capitalize on emerging opportunities. Forecasting models within the dashboard take this a step further, using algorithms to create accurate revenue predictions, thus enhancing resource allocation and strategic planning. For deeper insights, check out this helpful article: How to master sales engagement platforms.
Exception Reporting and Drill-Down Functionality
Not every data point holds the same weight. Exception reporting automatically flags unusual trends, anomalies, and potential issues. For instance, a sudden drop in conversion rates or an unexpected surge in deal cancellations triggers an alert. This empowers your team to swiftly investigate the root cause and implement corrective measures. Complementing this feature is drill-down functionality, which enables users to explore the detailed context behind the numbers. By clicking on a specific data point, sales managers can uncover the underlying factors that influence overall performance.
Dynamic Filtering and Intelligent Notifications
A static dashboard quickly becomes obsolete in a dynamic business environment. Dynamic filtering empowers users to customize their view according to their specific needs. Sales representatives can focus on individual performance metrics, while sales managers can analyze team-wide trends, all within the same flexible dashboard. Intelligent notifications complement dynamic filtering by delivering personalized alerts directly to relevant stakeholders. These aren't generic email blasts, but rather targeted messages that highlight specific opportunities and risks in real-time, prompting swift and informed action.
Mobile Optimization and AI-Powered Analytics
In today's mobile world, access to data on the go is critical. Mobile optimization ensures your sales KPI dashboard is accessible from any device, allowing your sales team to stay informed and responsive wherever they are. Integrating AI-powered analytics provides an additional layer of insightful analysis. AI algorithms can process complex data sets, uncover hidden patterns, and even predict customer behavior, providing a distinct advantage in closing deals.
To better understand the differences between a standard dashboard and one with advanced capabilities, let's look at a comparison table. This table will outline the distinct features and their potential impact on overall sales performance.
Dashboard Features Comparison
Comparison of basic vs advanced dashboard capabilities and their impact on sales performance
| Feature | Basic Level | Advanced Level | Performance Impact |
|---|---|---|---|
| Reporting | Static reports | Real-time updates, trend analysis | Improved responsiveness, proactive decisions |
| Data Analysis | Basic charts and graphs | Drill-down, AI-powered insights | Deeper data understanding, improved strategy |
| Alerts | Generic email notifications | Intelligent, personalized alerts | Timely action, minimized risks |
| Accessibility | Desktop only | Mobile optimized | Increased productivity, anytime access |
| Customization | Limited filtering options | Dynamic filtering | Tailored insights for specific user needs |
As the table highlights, advanced features offer significant advantages.
By implementing these advanced features, your sales KPI dashboard transforms from a simple reporting tool into a powerful engine for driving revenue growth and securing a substantial competitive advantage. These capabilities not only enhance data analysis but also empower sales teams to be truly proactive, anticipating market changes and responding effectively.
Measuring Dashboard Success And Continuous Optimization
Creating a sales KPI dashboard is just the first step. The real value comes from understanding its effectiveness and continually refining it to achieve better results. This goes beyond simply tracking user adoption and delves into the actual impact on sales performance.
Establishing Clear Criteria for Dashboard Success
Defining success for your sales KPI dashboard means looking past surface-level metrics like login frequency. Real success lies in its measurable impact on key sales outcomes. Are win rates improving? Is the speed of closing deals increasing? Are conversion rates rising? These questions reveal whether your dashboard truly delivers.
For example, if your sales team consistently hits their targets after the dashboard's implementation, that’s a strong sign of success. Also, consider qualitative aspects such as improved team communication and more data-driven decisions. These subtle changes can significantly boost overall sales performance.
Gathering Feedback and Identifying Improvement Opportunities
Regularly gathering feedback from your sales team is essential. Ask them directly how the dashboard helps (or hinders) them. Can they quickly find the information they need? Is the data clearly presented? Is anything missing that would improve their performance? This feedback loop offers valuable insights for continuous optimization.
This constant feedback ensures the dashboard stays relevant and useful. It also encourages the sales team to take ownership, motivating them to actively participate in its development.
Conducting Regular Dashboard Audits and Evolving with Your Business
Your sales KPI dashboard should evolve alongside your business. Regular audits help ensure it aligns with your current objectives. Are the tracked KPIs still relevant? Is the dashboard design still user-friendly? Is the data accurate and up-to-date?
These periodic checks reveal areas for improvement and allow you to adapt the dashboard to changing business needs. They also prevent feature creep, the tendency to add unnecessary features that clutter the dashboard and reduce its effectiveness. As SimpleKPI research shows, clean and focused dashboards are crucial for effective use.
Managing User Expectations and Maintaining Dashboard Relevance
Managing user expectations is key for long-term success. Clearly communicate the dashboard's purpose and functionality to your sales team. Provide training and offer ongoing support.
Stay informed about emerging trends in sales analytics and dashboard technology. This allows you to incorporate new features and functionalities that can enhance your team's performance. Just as HubSpot highlights in their research on content analysis, adapting to the changing landscape is vital for ongoing success.
Recognizing Warning Signs and Keeping Your Dashboard Aligned
Several warning signs indicate your dashboard needs attention. Declining user engagement, inaccurate data, and a lack of measurable impact on sales performance are all red flags. If your team is no longer using the dashboard or reverting to old methods, it’s time for a reassessment.
Keeping your dashboard aligned with business objectives requires constant attention. Regularly review your sales goals and ensure the dashboard continues to provide the necessary insights. This proactive approach makes sure your sales KPI dashboard remains a powerful tool for driving revenue growth and maximizing team performance.
Ready to elevate your sales performance with a robust and intuitive sales outreach platform? Explore Salesloop.io today. Discover how comprehensive features, from multichannel outreach to automated personalization, can accelerate your pipeline growth. Visit Salesloop.io now and start generating more leads and closing more deals.