
Unlocking Sales Potential: Metrics That Matter in 2025
Boosting your bottom line requires more than just closing deals; it demands sales efficiency. This listicle dives deep into eight essential sales efficiency metrics, providing the knowledge to optimize your sales processes and drive revenue growth. Whether you're a freelancer, manage a small team, or work within a large organization, understanding these metrics is crucial for success in 2025.
This guide moves beyond simple definitions. We'll explore how to calculate each metric, providing actionable benchmarks, and sharing best practices for improvement. You'll learn how to:
- Pinpoint bottlenecks hindering your sales performance
- Implement data-driven strategies to streamline your sales cycle
- Maximize your team's output and achieve sustainable growth
Focusing on sales efficiency metrics provides a clear path to improvement. These metrics offer tangible data points to identify areas of strength and weakness within your sales process. This allows for targeted interventions, optimizing resource allocation, and boosting overall performance.
This listicle explores eight key sales efficiency metrics:
- Sales Velocity
- Lead Response Time
- Sales Activity per Opportunity
- Win Rate by Sales Stage
- Customer Acquisition Cost (CAC) Payback Period
- Sales Cycle Length
- Pipeline Coverage Ratio
- Sales Rep Ramp Time
By mastering these sales efficiency metrics, you'll gain valuable insights into your sales performance. You'll be equipped to make data-driven decisions, optimize your strategies, and ultimately, achieve significant revenue growth. Let's dive in.
1. Sales Velocity
Sales velocity is a crucial sales efficiency metric that provides a holistic view of how quickly leads convert into revenue. It measures the speed and value generation within your sales pipeline, offering valuable insights into your overall sales performance. Think of it as the speedometer of your sales process, indicating how efficiently your team is converting opportunities into closed deals. This metric deserves its place on this list because it goes beyond simply tracking the number of deals closed; it incorporates the deal size, win rate, and sales cycle length to provide a more comprehensive picture of sales effectiveness.

Calculating Sales Velocity
Sales velocity is calculated using the following formula:
(Number of Opportunities * Average Deal Value * Win Rate) / Sales Cycle Length
This formula considers four key components:
- Number of Opportunities: The total number of qualified leads in your sales pipeline.
- Average Deal Value: The average value of closed deals.
- Win Rate: The percentage of opportunities that convert into closed-won deals.
- Sales Cycle Length: The average time it takes to close a deal, from initial contact to final sale.
Examples of Successful Implementation
Several companies have leveraged sales velocity to significantly improve their sales performance. HubSpot increased its sales velocity by 30% by implementing automated lead scoring and reducing sales cycle length. Salesforce uses sales velocity tracking across different product lines to optimize resource allocation. Even during challenging times, companies like Zoom saw improvements, increasing sales velocity by 25% in 2020 by streamlining their demo process and refining qualification criteria.
Actionable Tips for Improvement
- Regular Tracking: Track sales velocity weekly or bi-weekly to quickly identify and address any performance fluctuations.
- Granular Analysis: Break down the calculation by product line, geography, or individual sales rep for more targeted insights.
- Prioritize Improvement: Focus on improving the lowest-performing variable in the formula for maximum impact. For example, if your win rate is low, concentrate on improving sales training or lead qualification.
- Benchmarking: Use historical data to establish realistic benchmarks and targets. This will help you track progress and identify areas for improvement.
- Automation: Implement automated tracking systems to ensure data accuracy and free up your team's time.
When and Why to Use Sales Velocity
Sales velocity is a valuable metric for any business that relies on a sales pipeline. It's particularly beneficial for:
- Identifying Bottlenecks: Pinpoint areas in your sales process that are slowing down deal closures.
- Forecasting Revenue: Predict future revenue based on current sales velocity trends.
- Optimizing Sales Strategies: Make data-driven decisions about resource allocation, sales training, and marketing efforts.
- Improving Sales Performance: Track progress and measure the effectiveness of implemented changes.
Want a more comprehensive understanding of incorporating sales velocity into your key performance indicators? Learn more about building a Sales KPI Dashboard. By effectively monitoring and analyzing sales velocity, you can gain valuable insights into your sales process and drive significant improvements in sales efficiency.
2. Lead Response Time
Lead response time is a critical sales efficiency metric that measures the time interval between when a lead is generated (e.g., through a website form, phone call, or social media interaction) and when a sales representative makes initial contact. This metric deserves a spot on this list because it directly impacts lead qualification and conversion rates. Research consistently shows a strong correlation between fast response times and sales success, making it a key competitive advantage in today's fast-paced business environment. A prompt response demonstrates professionalism, attentiveness, and a genuine interest in the lead's needs.

Calculating Lead Response Time
While not a complex calculation, accurately tracking lead response time requires robust systems. It involves measuring the duration between lead creation timestamp and the first outbound communication timestamp (email, call, or other interaction). This data can be automatically tracked through CRM systems or dedicated lead management software. Calculating average response time across your team provides valuable insights into overall responsiveness.
Examples of Successful Implementation
Many companies have seen significant improvements by prioritizing lead response time. InsideSales.com research reveals that companies responding within 1 minute are 7x more likely to qualify leads than those responding after 1 hour. Drift, a conversational marketing platform, helped clients achieve sub-1-minute response times, leading to a 50% increase in qualified leads. Similarly, Marketo reduced their lead response time from 24 hours to under 5 minutes, resulting in a 45% increase in qualified opportunities.
Actionable Tips for Improvement
- Automated Lead Routing: Implement a system to automatically route leads to the appropriate sales rep based on territory, product, or other criteria.
- Real-Time Notifications: Set up real-time notifications via mobile apps or SMS to alert reps of new leads instantly.
- Response Time SLAs: Create specific response time service level agreements (SLAs) for different lead types. High-value leads may require immediate responses, while others might have a longer acceptable timeframe.
- Chatbots and Automated Responses: Utilize chatbots or automated email responses to instantly acknowledge lead submissions and provide basic information.
- Performance Tracking and Rewards: Regularly track individual rep response times and reward those who consistently meet or exceed targets.
When and Why to Use Lead Response Time
Tracking lead response time is essential for any business generating leads. It's particularly crucial for:
- Improving Lead Qualification: Increase the likelihood of converting leads into paying customers by engaging them promptly.
- Gaining a Competitive Edge: Differentiate your business by demonstrating responsiveness and customer focus.
- Optimizing Sales Processes: Identify inefficiencies in lead handling and implement improvements to streamline workflows.
- Enhancing Customer Experience: Start the customer journey on a positive note with prompt and efficient communication.
Want to further streamline your lead generation process? Learn more about automating lead generation. By actively monitoring and optimizing lead response time, businesses can significantly improve sales efficiency and drive revenue growth.
3. Sales Activity per Opportunity
Sales activity per opportunity is a vital sales efficiency metric that analyzes the number and types of sales activities – such as calls, emails, meetings, and demos – undertaken to move an opportunity through each stage of the sales pipeline. This metric deserves a spot on this list because it helps identify the optimal mix and intensity of activities required for successful deal progression, enabling sales teams to allocate their efforts more effectively and improve sales efficiency metrics overall. By understanding which activities yield the best results at each stage, you can optimize your sales process and improve conversion rates.
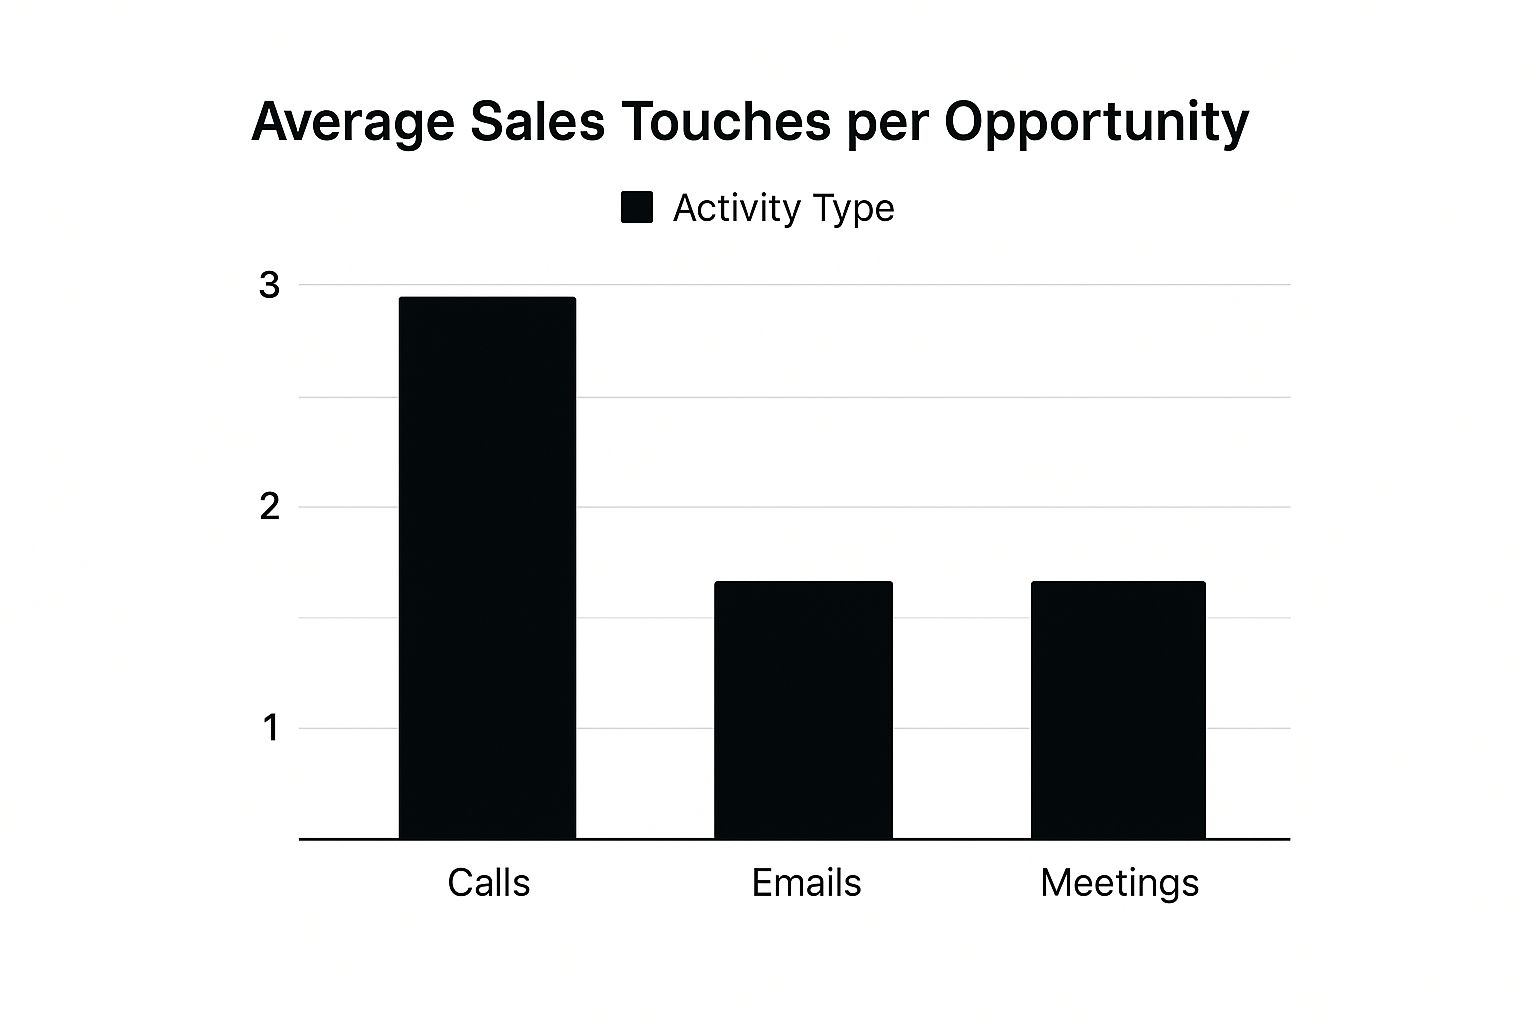
The bar chart above visualizes the average number of sales touches per opportunity, categorized by activity type. As the chart illustrates, calls constitute the largest share of touches, followed by emails and meetings.
Calculating Sales Activity per Opportunity
Tracking this metric involves monitoring the frequency and type of engagement with each opportunity within your CRM. This includes logging all calls, emails, meetings, presentations, and other relevant interactions. By analyzing this data, you can gain valuable insights into the effectiveness of your sales activities and identify areas for improvement.
Examples of Successful Implementation
Several organizations have successfully implemented sales activity tracking to improve their sales performance. Outreach.io found that successful B2B deals average eight touches across four different channels before closing. Salesforce data shows that deals with six or more activities in the first 30 days have 40% higher close rates. Gong.io analysis revealed that deals with three or more stakeholder interactions are 2.5 times more likely to close.
Actionable Tips for Improvement
- Create Activity Templates: Develop standardized activity templates for different deal types and sizes to ensure consistent and effective engagement.
- Track Timing and Sequence: Analyze the timing and sequence of activities, not just the total number, to identify optimal engagement patterns.
- Leverage CRM Automation: Use CRM automation to prompt sales representatives with the optimal next activities based on deal stage and history.
- Analyze Successful Deals: Study closed-won deals to identify successful activity patterns and replicate them in future opportunities.
- Balance Quantity with Quality: While activity volume is important, balance it with quality metrics like response rates and engagement levels.
When and Why to Use Sales Activity per Opportunity
Tracking sales activity per opportunity is beneficial for any sales team looking to optimize their sales process. It is particularly useful for:
- Identifying Bottlenecks: Pinpoint stages in the sales pipeline where opportunities stall due to insufficient or ineffective activity.
- Improving Sales Coaching: Provide targeted coaching to sales reps based on their activity levels and engagement effectiveness.
- Optimizing Sales Strategies: Refine sales strategies based on the activity patterns that correlate with higher conversion rates.
- Forecasting Sales Performance: Predict future sales performance based on current activity levels and historical trends.
By effectively monitoring and analyzing sales activity per opportunity, you can gain a deeper understanding of your sales process and drive significant improvements in sales efficiency. This metric empowers sales teams to focus on the most impactful activities, ultimately leading to increased conversions and revenue growth.
4. Win Rate by Sales Stage
Win rate by sales stage is a crucial sales efficiency metric that provides a granular view of your sales pipeline's effectiveness. It measures the percentage of opportunities that successfully advance from one stage to the next, offering valuable insights into where deals are most likely to stall or fail. This metric deserves its place on this list because it goes beyond simply tracking the overall win rate; it pinpoints specific bottlenecks in your sales process, enabling targeted improvements for maximum impact. Understanding stage-specific win rates empowers you to optimize each step of the sales journey and improve overall conversion rates.
Calculating Win Rate by Sales Stage
Calculating win rate by sales stage involves tracking the number of opportunities that progress from one stage to the next. For example, if 100 opportunities enter the "Solution Proposal" stage and 60 advance to the "Negotiation" stage, the win rate for the "Solution Proposal" stage is 60%. You should also track the overall win rate from each stage to closed-won. This provides a comprehensive understanding of the likelihood of closing a deal from any given point in the pipeline.
Examples of Successful Implementation
Several companies have leveraged stage-specific win rate analysis to significantly improve their sales performance. Microsoft, for instance, boosted its overall win rate by 15% by focusing on improvements in their qualification stage, where they initially had only a 40% progression rate. Adobe identified that deals stalling in the proposal stage had 23% lower win rates and implemented specialized training to address this bottleneck. Oracle uses stage-specific win rates to refine their sales forecasting accuracy, achieving over 95% forecast precision.
Actionable Tips for Improvement
- Define Clear Criteria: Establish clear, objective criteria for each sales stage progression to ensure consistent tracking.
- Track Forward and Backward Movement: Monitor not just forward progression, but also backward movement between stages to identify recurring issues.
- Stage-Specific Coaching: Develop targeted coaching programs based on win rate analysis for each stage.
- Optimize Stage Definitions: Use win rate data to optimize the definitions of your sales process stages.
- Benchmarking: Compare your win rates against industry standards for your specific market.
When and Why to Use Win Rate by Sales Stage
Win rate by sales stage is a valuable metric for any business with a defined sales pipeline. It's particularly beneficial for:
- Identifying Bottlenecks: Pinpoint specific stages where deals are most likely to stall or be lost.
- Improving Sales Process: Optimize individual stages of your sales process to improve overall conversion rates.
- Targeted Coaching: Focus sales training and coaching efforts on the areas with the lowest win rates.
- Improving Forecasting Accuracy: Refine sales forecasts by incorporating stage-specific win probabilities.
- Data-Driven Decision Making: Use win rate data to make informed decisions about resource allocation and sales strategies.
By effectively monitoring and analyzing win rate by sales stage, you gain valuable insights into your sales process and drive significant improvements in sales efficiency. This granular approach allows for a more targeted and impactful strategy for increasing overall sales performance.
5. Customer Acquisition Cost (CAC) Payback Period
Customer Acquisition Cost (CAC) payback period is a critical sales efficiency metric that reveals how long it takes for a new customer to generate enough revenue to offset the cost of acquiring them. It encompasses all sales and marketing expenses invested in acquiring that customer. This metric deserves a spot on this list because it directly impacts profitability and provides valuable insights into the efficiency of your sales and marketing investments. Understanding your CAC payback period is essential for sustainable growth and making informed decisions about resource allocation.
Calculating CAC Payback Period
The CAC payback period is calculated using the following formula:
CAC / (Gross Margin * Average Customer Monthly Revenue)
This formula considers three key components:
- Customer Acquisition Cost (CAC): The total cost of sales and marketing efforts to acquire a new customer.
- Gross Margin: The percentage of revenue remaining after deducting the cost of goods sold (COGS). Using gross margin provides a more accurate picture of profitability than gross revenue.
- Average Customer Monthly Revenue: The average revenue generated by a customer each month.
Examples of Successful Implementation
Several companies have successfully leveraged CAC payback period analysis to optimize their spending and improve profitability. Slack achieved a remarkable 5-month CAC payback period by optimizing their freemium conversion funnel, demonstrating the power of efficient onboarding and product-led growth. HubSpot maintains a 12-month average CAC payback across all customer segments by consistently focusing on customer retention and upselling. Zoom, during a period of rapid growth, reduced their CAC payback from 18 to 11 months by improving sales conversion rates and minimizing churn.
Actionable Tips for Improvement
- Gross Margin Focus: Calculate payback period using gross margin instead of gross revenue for a more accurate reflection of profitability.
- Channel-Specific Tracking: Track payback periods by acquisition channel (e.g., paid advertising, social media, referrals) to optimize marketing spend and identify high-performing channels.
- Target Setting: Establish realistic payback period targets based on your specific cash flow requirements and growth objectives.
- Lifetime Value Consideration: Factor in customer lifetime value (CLTV) when evaluating acceptable payback periods. A longer payback period might be acceptable for high-CLTV customers.
- Trend Monitoring: Monitor trends over time to identify patterns and avoid making decisions based on single-period fluctuations.
When and Why to Use CAC Payback Period
Analyzing CAC payback period is crucial for any business focused on acquiring new customers. It's particularly beneficial for:
- Investment Optimization: Determine the optimal allocation of resources across different sales and marketing channels.
- Profitability Assessment: Evaluate the profitability of your customer acquisition efforts and identify areas for improvement.
- Growth Planning: Set realistic growth targets based on your CAC payback period and available resources.
- Pricing Strategy: Inform pricing decisions to ensure sustainable profitability and achieve desired payback periods.
By diligently monitoring and analyzing your CAC payback period, you can gain a deeper understanding of your sales and marketing ROI and drive significant improvements in sales efficiency. This metric is a powerful tool for making data-driven decisions and achieving sustainable, profitable growth.
6. Sales Cycle Length
Sales cycle length is a fundamental sales efficiency metric that measures the average time it takes to close a deal, from the first qualified interaction with a prospect to the final sale (won or lost). Understanding this metric is crucial for accurate sales forecasting, efficient resource allocation, and identifying opportunities to optimize your sales process. It earns a spot on this list because it directly impacts revenue generation and provides valuable insights into the effectiveness of your sales strategies. A shorter sales cycle often translates to increased revenue and improved sales efficiency.
Calculating Sales Cycle Length
While seemingly straightforward, calculating sales cycle length requires focusing on qualified leads. Track the time elapsed from the first qualified interaction, not the initial marketing touch. This ensures you're measuring the actual time spent selling and avoids inflating the cycle length with unqualified leads. Simply calculate the average duration of all closed deals (both won and lost) within a specific timeframe.
Examples of Successful Implementation
Many companies have successfully leveraged sales cycle length analysis to drive significant improvements. Salesforce reduced their average sales cycle from 9 to 6 months by implementing stricter qualification criteria, focusing their efforts on high-potential prospects. DocuSign shortened their enterprise sales cycle by 30% through improved demo processes and tailored proof-of-concept programs. Workday utilizes differentiated cycle length targets based on deal size: 3 months for deals under $100,000 and up to 18 months for deals exceeding $1 million, demonstrating a strategic approach to managing varying sales complexities.
Actionable Tips for Improvement
- Track from Qualification: Begin tracking cycle length from the first qualified interaction, not the initial marketing touch. This provides a more accurate representation of your sales team's performance.
- Segment Your Analysis: Analyze cycle length by deal characteristics such as product type, deal size, or industry. This granular approach reveals specific areas for improvement.
- Identify Bottlenecks: Pinpoint common bottlenecks that unnecessarily extend the sales cycle. These could include slow proposal turnaround times, inefficient approval processes, or ineffective follow-up procedures.
- Set Realistic Expectations: Use sales cycle length data to set realistic expectations with prospects. This builds trust and transparency throughout the sales process.
- Create Urgency: Consider implementing strategies to create a sense of urgency, such as limited-time offers or clearly defined implementation deadlines.
When and Why to Use Sales Cycle Length
Monitoring sales cycle length is essential for any business that relies on a sales pipeline. This metric is particularly useful for:
- Improving Sales Forecasting: Accurate sales cycle length data enables more precise revenue forecasting and informed business decisions.
- Optimizing Resource Allocation: Understanding cycle length helps allocate sales resources effectively, ensuring appropriate focus on deals at different stages.
- Identifying Process Inefficiencies: Analyzing cycle length variations can reveal inefficiencies in the sales process and highlight areas for improvement.
- Enhancing Sales Performance: By tracking and optimizing cycle length, businesses can accelerate deal closures and improve overall sales performance.
Want to delve deeper into optimizing your sales process? Learn more about sales process optimization. By effectively monitoring and analyzing sales cycle length, you can gain valuable insights into your sales efficiency and drive significant improvements in revenue generation.
7. Pipeline Coverage Ratio
Pipeline coverage ratio is a vital sales efficiency metric that provides a forward-looking view of your sales pipeline's health. It measures the relationship between the total value of opportunities in your pipeline and your sales quota or revenue target. This metric deserves a spot on this list because it helps predict whether you have enough potential deals to achieve your goals, enabling proactive adjustments to avoid revenue shortfalls. Think of it as your sales team's financial forecast, indicating the likelihood of hitting revenue targets.
Calculating Pipeline Coverage Ratio
Calculating the pipeline coverage ratio is straightforward:
Total Pipeline Value / Sales Quota or Revenue Target
This formula considers two key components:
- Total Pipeline Value: The sum of the estimated value of all opportunities in your sales pipeline.
- Sales Quota or Revenue Target: The revenue goal set for a specific period (e.g., monthly, quarterly, annually).
Examples of Successful Implementation
Several companies effectively utilize pipeline coverage ratios to manage their sales performance. Salesforce, for example, maintains a 3:1 pipeline coverage ratio as their standard across all sales teams. HubSpot differentiates its coverage ratio based on deal type, using a 4:1 ratio for new business and a 2:1 ratio for expansion revenue due to varying win rates. Microsoft adjusts coverage ratios based on seasonal patterns, employing a 5:1 ratio in Q1 and a 3:1 ratio in Q4.
Actionable Tips for Improvement
- Probability Weighting: Use probability-weighted pipeline values for a more accurate coverage calculation. This accounts for the likelihood of each opportunity closing.
- Tailored Ratios: Adjust coverage ratios based on historical win rates and specific sales patterns within different segments.
- Time Horizon Tracking: Track coverage ratios at multiple time horizons (e.g., 30, 60, 90 days) to gain a more granular view of pipeline health.
- Multi-Level Monitoring: Include both individual rep and team-level coverage monitoring to identify specific areas for improvement.
- Automated Alerts: Create automated alerts when coverage drops below predefined threshold levels to trigger timely interventions.
When and Why to Use Pipeline Coverage Ratio
Pipeline coverage ratio is an invaluable metric for any business with a defined sales pipeline. It’s especially useful for:
- Predicting Revenue: Forecast future revenue based on current pipeline health and coverage ratios.
- Identifying Gaps: Proactively identify potential revenue shortfalls and take corrective action.
- Resource Allocation: Optimize resource allocation based on pipeline coverage across different segments or territories.
- Sales Strategy Adjustments: Make data-driven adjustments to sales strategies based on coverage trends.
- Performance Monitoring: Monitor sales team performance and identify areas needing improvement.
By consistently monitoring and analyzing your pipeline coverage ratio, you can gain valuable insights into the health of your sales pipeline and make informed decisions to improve sales efficiency and achieve your revenue targets. This proactive approach allows for more accurate forecasting and better resource allocation, ultimately driving consistent sales growth.
8. Sales Rep Ramp Time
Sales rep ramp time is a critical sales efficiency metric that measures the time it takes for a new sales representative to become fully productive. This is typically defined as achieving 100% of their quota or target performance levels. Understanding and optimizing ramp time is essential for scaling sales organizations efficiently and calculating the true cost and ROI of sales hiring and training programs. This metric deserves its place on this list because it directly impacts revenue generation and overall sales team performance. A shorter ramp time translates to faster revenue growth and a quicker return on investment in new hires.
Calculating Sales Rep Ramp Time
While the ultimate goal is 100% quota attainment, ramp time can be measured using various milestones. These can include achieving a certain percentage of quota, closing a specific number of deals, or demonstrating proficiency in key sales activities. Tracking these milestones allows for a more granular analysis of the ramp process and identifies potential areas for improvement.
Examples of Successful Implementation
Several companies have successfully optimized their sales rep ramp time through strategic initiatives. Stripe reduced their sales rep ramp time from nine to five months by implementing structured mentorship programs, pairing new hires with experienced sales professionals. Atlassian achieved a three-month ramp time for inside sales reps through comprehensive product training and shadowing opportunities, allowing them to quickly learn the ropes. Snowflake's enterprise reps, dealing with more technical products and larger deal sizes, average a 12-month ramp time, demonstrating the impact of deal complexity on ramp time.
Actionable Tips for Improvement
- Structured Onboarding: Create structured onboarding programs with clear milestones and checkpoints to guide new hires through the initial stages of their role.
- Mentorship Programs: Assign experienced mentors to accelerate learning, provide guidance, and foster relationship building within the team.
- Realistic Quota Relief: Provide realistic quota relief during the ramp period to maintain motivation and allow new reps to focus on learning and development.
- Leading Indicator Tracking: Track leading indicators like activity levels (calls, emails, meetings) and pipeline development to gauge progress and identify early warning signs.
- Continuous Optimization: Continuously analyze successful rep ramp patterns and adapt training programs based on best practices and areas for improvement.
When and Why to Use Sales Rep Ramp Time
Tracking and analyzing sales rep ramp time is crucial for any organization with a sales team, particularly those focused on growth and scaling. This metric is essential for:
- Calculating Sales ROI: Determine the true cost of hiring and training new sales representatives and measure the return on investment.
- Improving Sales Forecasting: Accurately predict future revenue based on the ramp time of new hires and their projected contribution.
- Optimizing Resource Allocation: Efficiently allocate resources to training and development programs based on ramp time data.
- Enhancing Sales Performance: Identify bottlenecks in the onboarding process and implement targeted improvements to accelerate ramp time and improve overall sales performance.
By actively monitoring and managing sales rep ramp time, sales leaders can drive significant improvements in sales efficiency, accelerate revenue growth, and maximize the return on investment in their sales teams. A shorter ramp time contributes directly to improved sales efficiency metrics and overall business success.
Sales Efficiency Metrics Comparison Table
| Metric | Implementation Complexity 🔄 | Resource Requirements ⚡ | Expected Outcomes 📊 | Ideal Use Cases 💡 | Key Advantages ⭐ |
|---|---|---|---|---|---|
| Sales Velocity | Moderate to High – requires multi-source accurate data and formula understanding | High – data integration across sales pipeline variables | Holistic sales efficiency, revenue forecasting, bottleneck identification | Teams needing comprehensive performance and forecasting insights | Comprehensive view combining speed & value; strategic process optimization |
| Lead Response Time | Low – simple tracking of time intervals | Low – requires automated/manual tracking systems | Faster lead qualification, higher conversion rates | Fast-paced sales environments where response speed is critical | Direct impact on conversion; simple, actionable metric |
| Sales Activity per Opportunity | Moderate – needs consistent logging of various sales activities | Moderate – time investment for activity tracking & CRM tools | Optimized sales effort, better forecasting, improved coaching | Managing sales rep activities and effort allocation | Identifies best practices; improves activity planning and coaching |
| Win Rate by Sales Stage | Moderate to High – needs consistent stage definitions and historical data | Moderate – requires pipeline stage tracking and data analysis | Granular sales funnel insights; targeted process improvements | Teams focusing on process bottlenecks and stage conversion | Pinpoints exact stages for improvement; granular forecasting |
| CAC Payback Period | Moderate – requires accurate cost and revenue data aggregation | Moderate to High – involves finance and salesMarketing data | ROI measurement on acquisition, budgeting & growth planning | Evaluating marketing and sales investment efficiency | Clear ROI; optimizes spending; critical for growth strategies |
| Sales Cycle Length | Low to Moderate – track timeline from contact to close | Low to Moderate – requires CRM tracking & segmentation | Sales velocity insight; forecasting; resource planning | General sales performance monitoring and process optimization | Critical for forecasting; identifies inefficiencies and bottlenecks |
| Pipeline Coverage Ratio | Low – simple ratio calculation with weighted pipeline data | Low – depends on pipeline valuation accuracy | Predictive sales health indicator; quota risk warning | Pipeline health monitoring and quota achievement planning | Early warning system; simple, easy-to-understand forecast metric |
| Sales Rep Ramp Time | Moderate – tracking from hire to full productivity requires milestone setting | Moderate to High – onboarding, training, and performance tracking | Workforce planning; hiring ROI; onboarding effectiveness | Scaling sales teams and optimizing rep training | Improves hiring efficiency; benchmarks onboarding success |
Elevate Your Sales Game: Actionable Strategies for Success
This in-depth exploration of sales efficiency metrics has provided a roadmap for optimizing your sales processes and driving significant improvements in performance. From understanding the rapid insights offered by sales velocity to minimizing customer acquisition cost (CAC) payback periods, each metric discussed offers a unique lens through which to analyze and enhance your sales strategies. We've delved into calculating these crucial metrics, established industry benchmarks, and outlined best practices for improvement. By focusing on these key indicators, you can identify bottlenecks, streamline operations, and ultimately boost your bottom line.
Key Takeaways for Enhanced Sales Performance
Let's recap the most critical takeaways to ensure you're equipped to implement these strategies effectively:
- Prioritize Speed and Efficiency: Metrics like lead response time and sales cycle length highlight the importance of speed in today's fast-paced sales environment. Faster response times and shorter sales cycles often translate to increased win rates and improved revenue generation.
- Focus on Activities that Drive Results: Measuring sales activity per opportunity allows you to identify and prioritize the actions that contribute most significantly to closing deals. This focus on impactful activities maximizes efficiency and eliminates wasted effort.
- Optimize Each Stage of the Sales Pipeline: Analyzing win rates by sales stage provides valuable insights into potential weaknesses in your sales process. Addressing these weaknesses enables you to optimize each stage and improve overall conversion rates.
- Control Costs and Maximize ROI: Metrics like customer acquisition cost (CAC) payback period and sales rep ramp time emphasize the importance of managing costs and achieving a rapid return on investment. Efficient onboarding and cost-effective acquisition strategies are essential for sustainable growth.
- Data-Driven Decision Making is Paramount: The effective use of sales efficiency metrics empowers data-driven decision-making. By continuously monitoring these metrics, you can track progress, identify areas for improvement, and adapt your strategies to achieve optimal results.
Implementing Sales Efficiency Metrics for Long-Term Success
Mastering these sales efficiency metrics is not just about tracking numbers; it's about building a foundation for sustainable growth and achieving long-term success. By implementing the actionable strategies outlined in this article, you can create a more efficient, predictable, and profitable sales organization. This means empowering your sales team to perform at their best, optimizing your sales processes for maximum impact, and ultimately achieving your revenue goals. Furthermore, by understanding the interplay between these metrics, you can gain a holistic view of your sales performance and identify opportunities for continuous improvement. This proactive approach allows you to adapt to market changes, stay ahead of the competition, and ensure long-term success in the dynamic landscape of sales.
The Future of Sales Efficiency: Embracing Technology
In 2025 and beyond, leveraging technology will be crucial for maximizing sales efficiency. Tools like Salesloop.io can provide valuable support in tracking, analyzing, and optimizing your sales performance based on these key metrics. This empowers your team to focus on selling, while automated processes handle data collection and analysis.
Ready to streamline your sales operations and boost your team's performance? Discover how Salesloop.io can help you harness the power of sales efficiency metrics. Visit Salesloop.io today to learn more and request a demo.