
Accurate sales forecasting is the bedrock of strategic growth, separating proactive businesses from reactive ones. Yet, many B2B teams struggle, caught between overly optimistic guesses and complex models that seem disconnected from reality. How do leading companies consistently predict revenue with precision? It's not magic; it’s a matter of choosing the right methodology for the right situation. This guide moves beyond theory to dissect seven powerful examples of sales forecasting, from straightforward pipeline analysis to sophisticated machine learning models.
For each method, we provide a strategic breakdown, tactical insights, and replicable strategies you can apply directly to your own sales process. We will explore time series analysis, regression models, bottom-up forecasting, and more, showing you not just what they are, but how to use them effectively.
Whether you're a small business refining your pipeline or an enterprise managing complex market dynamics, these examples will equip you to build more reliable, data-driven forecasts. The goal is to drive intelligent business decisions and accelerate growth by transforming raw sales data into a predictable revenue engine. We will also touch on how modern platforms can streamline the data collection and outreach that fuel these essential forecasting activities.
1. Time Series Analysis
Time series analysis is a quantitative sales forecasting method that uses historical data points collected over sequential time intervals to predict future outcomes. This statistical technique examines past sales performance to identify recurring patterns, such as trends, seasonal fluctuations, and cyclical movements. By understanding these historical behaviors, businesses can create more accurate projections.
This method is one of the most foundational examples of sales forecasting because it relies on the principle that past patterns will continue into the future. It's particularly powerful for established businesses with consistent historical data. For instance, retail giant Walmart uses time series models to manage inventory across its thousands of stores, anticipating demand for products based on years of sales data. Similarly, Coca-Cola analyzes seasonal patterns to predict spikes in beverage consumption during holidays or summer months.
Strategic Breakdown and Application
The core of time series analysis lies in its ability to deconstruct complex data into understandable components. The two most common techniques are:
- Exponential Smoothing: This method assigns exponentially decreasing weights to older observations, giving more significance to recent data. It's ideal for forecasts without clear trend or seasonal components.
- ARIMA (AutoRegressive Integrated Moving Average): Developed by George Box and Gwilym Jenkins, this advanced model captures complex relationships within the data. It's suitable for data with trends and seasonal patterns, making it highly versatile for B2B sales cycles that may be influenced by economic quarters or industry events.
The following infographic illustrates the fundamental workflow for applying a time series model like ARIMA.
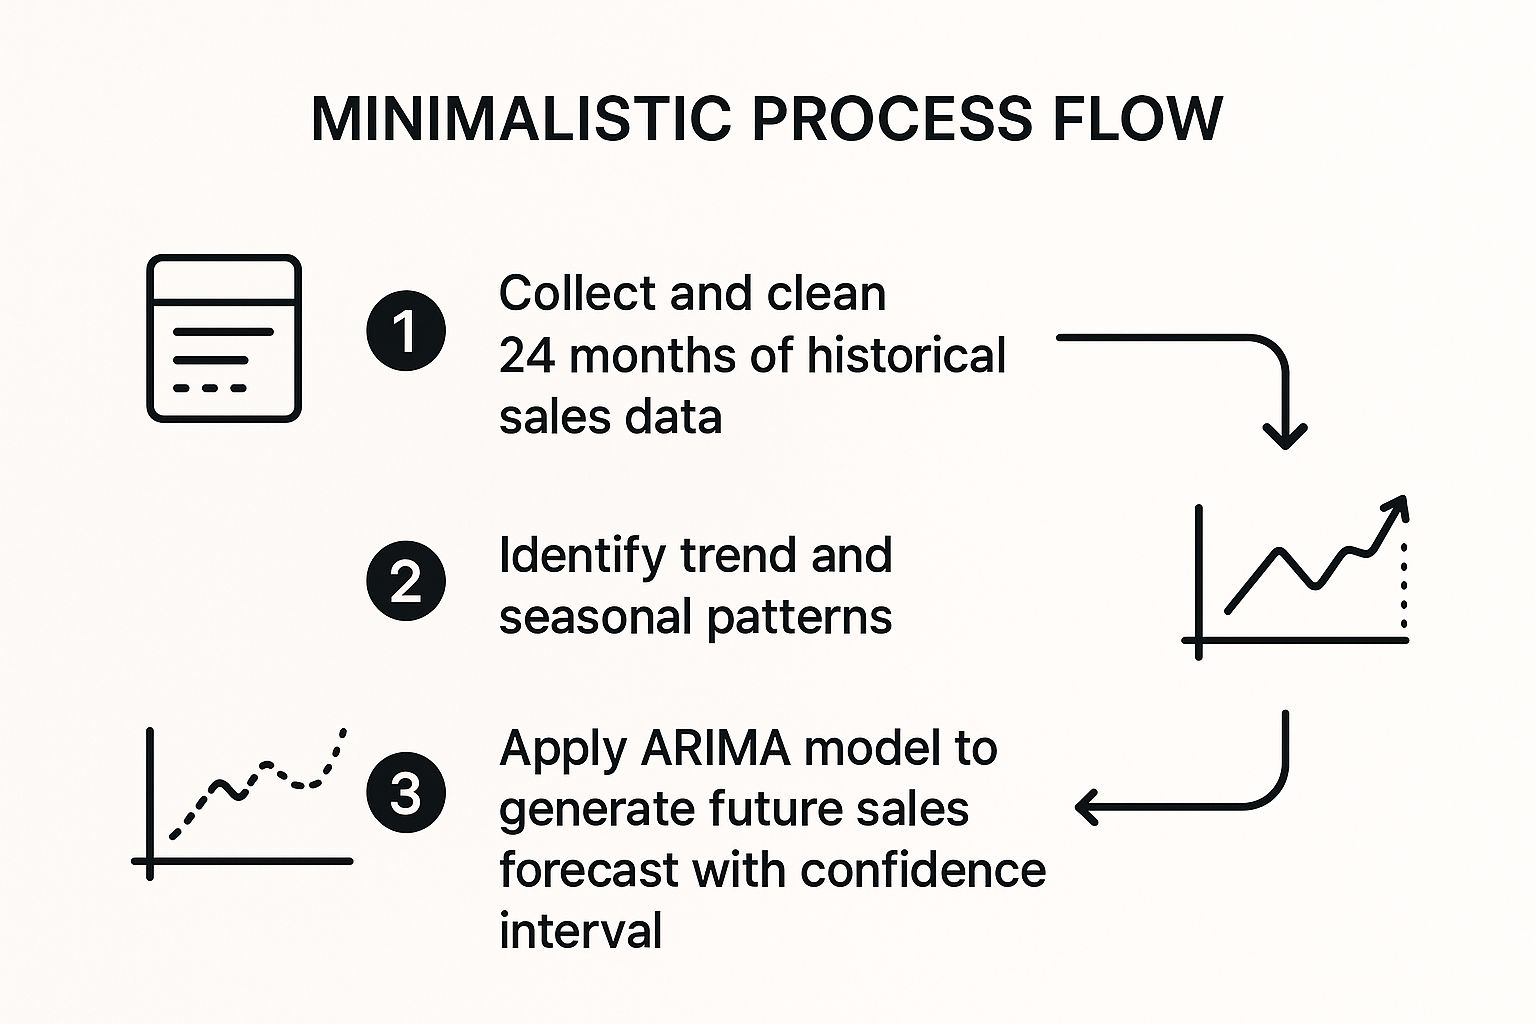
This process highlights the importance of starting with high-quality data and systematically identifying patterns before generating a forecast.
Actionable Takeaways
To effectively implement time series analysis, follow these best practices:
- Ensure Data Integrity: Start with clean data. Remove outliers, correct errors, and fill any gaps in your sales history. Inaccurate data is the number one cause of faulty forecasts.
- Gather Sufficient History: For reliable seasonal analysis, use a minimum of 24 months of data. This provides at least two full seasonal cycles, allowing the model to distinguish true seasonality from random noise.
- Incorporate External Factors: Enhance your model by considering external variables. Integrate data on marketing campaigns, major holidays, or economic indicators to add context and improve accuracy.
2. CRM-Based Pipeline Forecasting
CRM-based pipeline forecasting is a qualitative method that leverages your Customer Relationship Management (CRM) system to predict future sales. It works by tracking individual opportunities as they move through predefined sales stages, from initial contact to a closed deal. Each stage is assigned a probability percentage based on historical win rates, allowing for a weighted forecast of potential revenue.
This approach is one of the most widely used examples of sales forecasting for modern B2B sales teams because it provides a real-time, deal-by-deal view of potential revenue. For example, Salesforce reports that customers using its CRM for pipeline forecasting see an average 37% improvement in forecast accuracy. Similarly, Microsoft Dynamics 365 helped Schneider Electric boost its forecast precision by 25% by standardizing its pipeline stages and probabilities.

Strategic Breakdown and Application
The strength of this method is its direct link between sales activities and revenue prediction. The forecast is calculated by multiplying each deal's value by its stage probability. The two primary approaches for applying this are:
- Stage-Based Probability: This common technique assigns a fixed win probability to each stage in your sales process. For instance, deals in the "Proposal Sent" stage might have a 50% probability, while those in "Contract Negotiation" have a 75% chance of closing.
- Opportunity Scoring: A more advanced method that uses AI or rule-based systems within the CRM to assign a unique probability score to each deal. This score considers factors beyond just the sales stage, such as lead source, engagement level, and company size.
The formula is straightforward: Forecasted Revenue = Σ (Deal Value × Stage Probability) for all open opportunities. This direct calculation gives sales leaders a clear, defensible view of the pipeline.
Actionable Takeaways
To maximize the accuracy of CRM-based forecasting, implement these strategies:
- Define Objective Stage Criteria: Eliminate guesswork by creating clear, non-negotiable exit criteria for each sales stage. For instance, a deal cannot move to "Qualified" until a budget and decision-maker have been confirmed.
- Practice Strict CRM Hygiene: A forecast is only as reliable as the data it's built on. Implement mandatory fields for close dates and deal values and conduct regular data clean-ups. For a deeper dive, explore these best practices for maintaining excellent CRM data hygiene on salesloop.io.
- Continuously Refine Probabilities: Don't use default probabilities. Analyze your historical win rates for each stage over the last 6-12 months and adjust your percentages accordingly. Revisit these figures quarterly to ensure they reflect your team's current performance.
3. Regression Analysis
Regression analysis is a statistical method used to model the relationship between a dependent variable (sales) and one or more independent variables. This technique goes beyond historical sales data to understand why sales fluctuate, allowing businesses to predict future performance based on the factors that drive it, such as marketing spend, pricing strategies, or economic conditions.
This method stands out as one of the most insightful examples of sales forecasting because it quantifies the impact of specific business drivers on revenue. It helps answer critical questions like, "How will a 10% increase in our advertising budget affect next quarter's sales?" For example, Procter & Gamble uses sophisticated regression models to determine the optimal marketing spend for each of its brands. Similarly, Tesla incorporates data on EV adoption rates, government incentives, and economic indicators into its regression models to forecast vehicle demand with greater precision.
Strategic Breakdown and Application
Regression analysis builds a mathematical equation that connects sales to its drivers. By identifying the strength and direction of these relationships, businesses can make more informed strategic decisions. The two primary types are:
- Simple Linear Regression: This model examines the relationship between sales and a single independent variable, like the impact of website traffic on online sales. It's an excellent starting point for understanding a primary driver.
- Multiple Regression: This more advanced model incorporates several independent variables at once. For instance, a B2B software company might use multiple regression to forecast sales based on the number of sales demos conducted, marketing qualified leads (MQLs) generated, and the overall industry growth rate.
This multi-faceted approach allows businesses to create a dynamic forecasting model that adapts to changes in key business levers and external market forces, providing a much richer view than methods based solely on past performance.
Actionable Takeaways
To effectively implement regression analysis for sales forecasting, consider these best practices:
- Validate Your Model: Always test your model's predictive accuracy using out-of-sample data. This involves training the model on one portion of your data and testing its performance on another portion it hasn't seen before.
- Check for Multicollinearity: Ensure your independent variables are not highly correlated with each other. For example, if advertising spend and the number of sales reps are closely linked, it can distort the model's results and make it difficult to isolate the true impact of each factor.
- Regularly Update Inputs: Market conditions and business strategies change. Refresh your model regularly with new data on internal activities (e.g., pricing changes) and external factors (e.g., new competitors, economic shifts) to maintain its relevance and accuracy.
4. Machine Learning Predictive Models
Machine learning predictive models are advanced forecasting systems that use artificial intelligence to analyze vast amounts of complex data. These models employ algorithms like neural networks and random forests to identify intricate patterns and non-linear relationships that traditional statistical methods often miss, leading to highly accurate sales predictions.
This approach represents the cutting edge of examples of sales forecasting, moving beyond historical trends to incorporate a multitude of internal and external variables. For instance, Netflix uses sophisticated ML models not just for content recommendations but to forecast subscriber growth and predict content demand, optimizing production investments. Similarly, fast-fashion giant Zara leverages machine learning to analyze real-time sales data, social media trends, and runway shows to predict which clothing items will sell best, allowing for rapid inventory adjustments.

Strategic Breakdown and Application
Machine learning excels at synthesizing diverse datasets to produce a holistic forecast. It can simultaneously analyze historical sales, customer behavior data, marketing campaign performance, economic indicators, and even competitor pricing to generate its predictions. This capability makes it invaluable for businesses operating in dynamic, fast-changing markets.
- Random Forests: This technique builds multiple decision trees and merges them to get a more accurate and stable prediction. It's excellent for handling large datasets with numerous variables, such as those found in e-commerce or SaaS sales.
- Gradient Boosting Machines (GBM): This method builds models sequentially, with each new model correcting the errors of its predecessor. It is highly effective and often provides best-in-class accuracy for structured data, making it popular in B2B sales where deal attributes and lead scores are critical. To delve deeper into how AI can predict customer behavior, you can explore the future of sales on salesloop.io.
Actionable Takeaways
To successfully leverage machine learning for sales forecasting, focus on data quality and methodical implementation:
- Prioritize High-Quality Data: Machine learning models are only as good as the data they are trained on. Ensure your historical data is clean, comprehensive, and accurately labeled before you begin.
- Start Simple: Begin with simpler, more interpretable algorithms like linear regression or decision trees before moving to more complex "black box" models like neural networks. This helps establish a performance baseline.
- Maintain Human Oversight: AI-driven forecasts should always be validated by experienced sales leaders. Use the model's output as a powerful decision-support tool, not as an unquestionable final word.
5. Bottom-Up Forecasting
Bottom-up forecasting is a granular, quantitative method where sales projections are built from the ground up. The process starts at the most detailed level, such as individual sales representatives, specific products, or customer accounts. These individual forecasts are then aggregated, or "rolled up," to create a comprehensive forecast for a territory, a region, and ultimately, the entire company.
This technique is one of the most practical examples of sales forecasting because it leverages the firsthand knowledge of those closest to the customers. It is particularly effective in B2B environments where sales cycles are complex and relationship-driven. For example, enterprise software giant Oracle empowers its global sales teams to forecast sales for their specific territories, which are then combined to inform corporate-level financial planning. Similarly, Cisco Systems utilizes this method to gather intelligence from its sales force, which understands the unique buying signals and pipeline health within each market segment.
Strategic Breakdown and Application
The power of bottom-up forecasting comes from its reliance on real-world, frontline insights rather than high-level assumptions. The accuracy of this approach depends on the quality and consistency of the input from the sales team.
- Territory and Account-Level Input: Sales representatives forecast sales based on their pipeline, deal stages, and direct conversations with prospects. They assess the probability of closing each deal within a specific timeframe.
- Aggregation and Validation: Sales managers collect forecasts from their team members, review them for accuracy and potential biases, and then aggregate them into a regional or divisional forecast. This roll-up process continues up the management chain.
This method transforms the sales team from simple quota-hitters into strategic partners who actively contribute to the company's financial planning and resource allocation.
Actionable Takeaways
To successfully implement a bottom-up forecasting model, focus on process and empowerment:
- Provide Clear Guidelines: Equip your sales team with standardized templates and clear instructions. Define deal stages, probability percentages, and submission deadlines to ensure consistency across the board.
- Utilize Your CRM: Implement the forecasting process directly within your CRM system. This centralizes data collection, automates the aggregation process, and makes it easier to track changes and forecast accuracy over time.
- Combine with Top-Down Analysis: Validate the bottom-up forecast by comparing it against a top-down model (one based on market size and company goals). Significant discrepancies can highlight potential sandbagging, overly optimistic projections, or shifts in the market that leadership needs to address.
6. Market Research and Survey-Based Forecasting
Market research and survey-based forecasting is a qualitative method that predicts future sales by directly gathering insights from potential customers and industry experts. This approach uses primary data from tools like surveys, focus groups, and interviews to gauge market sentiment, purchase intent, and brand perception. It is especially useful when historical sales data is unavailable, such as with new product launches or market entries.
This technique is one of the most proactive examples of sales forecasting because it captures forward-looking customer intentions rather than relying solely on past performance. It's indispensable for innovation-driven companies. For example, before scaling production of the Model 3, Tesla used extensive market research and pre-order data to forecast initial demand. Similarly, Netflix continuously surveys users and analyzes viewing habits to forecast demand for original content, guiding its multi-billion dollar production budget.
Strategic Breakdown and Application
The power of this method lies in its ability to directly tap into the "voice of the customer" to understand future buying behavior. Key techniques include:
- Purchase Intent Surveys: Directly asking potential customers about their likelihood of purchasing a product at a specific price point. This provides a clear, though sometimes optimistic, measure of demand.
- Expert Opinion Panels: Gathering insights from industry analysts, consultants, and internal experts (like senior salespeople) to form a consensus forecast. This is often accomplished through methods like the Delphi technique to reduce bias.
By asking direct questions about buying likelihood, companies can build a demand model from the ground up, which is critical in volatile or emerging markets.
Actionable Takeaways
To effectively implement survey-based forecasting, consider these best practices:
- Ensure a Representative Sample: Your survey respondents must accurately reflect your target market's demographics. A skewed sample will produce a skewed forecast.
- Ask about Likelihood and Timing: Go beyond simple interest. Ask questions like, "On a scale of 1-10, how likely are you to purchase this in the next six months?" to get more quantifiable data.
- Combine with Other Methods: Use survey data to validate or adjust quantitative forecasts. For example, if your time series model predicts a 5% increase but your market research indicates strong headwinds, you can adjust your forecast downward. To learn more, explore the different types of market research on salesloop.io.
7. Economic Indicator-Based Forecasting
Economic indicator-based forecasting is a macro-level quantitative method that predicts future sales by correlating them with broader economic trends. This approach links sales performance to key metrics like GDP growth, unemployment rates, consumer confidence, and interest rates. By understanding how the wider economy influences customer purchasing behavior, businesses can anticipate market shifts and adjust their strategies accordingly.
This method is one of the most strategic examples of sales forecasting because it ties internal performance directly to external market forces. It is particularly valuable for industries sensitive to economic cycles. For instance, Caterpillar closely monitors construction and mining indicators to forecast demand for heavy machinery. Similarly, Home Depot correlates its sales projections with housing starts and consumer confidence, while Ford Motor Company uses automotive industry indicators and lending rates to predict vehicle sales.
Strategic Breakdown and Application
The power of this method lies in identifying the right leading indicators that signal future market movements, rather than lagging indicators that only confirm past events. The analysis involves establishing a statistical correlation between a chosen economic metric and your company's sales data. Key approaches include:
- Leading Indicator Analysis: This involves focusing on predictive metrics. For a B2B software company, an increase in the Purchasing Managers' Index (PMI) could signal that companies are planning to expand operations and invest in new technology, thus predicting a future rise in sales.
- Correlation and Regression Modeling: This statistical technique formally models the relationship between sales and one or more economic indicators. It allows you to quantify how a change in an indicator, like a 1% rise in GDP, is likely to impact your sales revenue.
Actionable Takeaways
To effectively implement economic indicator-based forecasting, follow these best practices:
- Identify Key Indicators: Pinpoint the 3-5 economic indicators most relevant to your business. A luxury goods brand might track discretionary spending, while an industrial manufacturer might follow raw material prices. Sources like Federal Reserve Economic Data (FRED) are invaluable for this.
- Use Leading Indicators: Prioritize leading indicators over lagging ones. Leading indicators, such as building permits or new business orders, provide predictive insights, giving you time to adapt your sales strategy proactively.
- Combine with Other Methods: This model provides a high-level view, so combine it with granular methods like opportunity stage forecasting. This creates a comprehensive forecast that is grounded in both macro-economic reality and your immediate sales pipeline.
7-Key Sales Forecasting Methods Comparison
| Forecasting Method | Implementation Complexity 🔄 | Resource Requirements ⚡ | Expected Outcomes 📊 | Ideal Use Cases 💡 | Key Advantages ⭐ |
|---|---|---|---|---|---|
| Time Series Analysis | Moderate 🔄: needs statistical skills | Low-Medium ⚡: historical data focus | Accurate for stable markets, identifies trends | Stable markets with sufficient historical data | Cost-effective, identifies seasonality |
| CRM-Based Pipeline Forecasting | Low-Moderate 🔄: CRM setup and update | Medium ⚡: requires CRM and training | Real-time, opportunity-level forecast accuracy | Sales teams using CRM, managing pipeline stages | Real-time visibility, customizable |
| Regression Analysis | High 🔄: statistical expertise needed | Medium-High ⚡: data and analytic tools | Identifies drivers, tests scenarios | Multi-factor impact analysis and scenario testing | Identifies sales influencers, scenario testing |
| Machine Learning Predictive Models | Very High 🔄: complex modeling | High ⚡: large data and computing power | High accuracy, finds complex patterns | Large datasets, diverse data, complex patterns | Extremely accurate, continuous learning |
| Bottom-Up Forecasting | Moderate-High 🔄: data collection effort | Medium ⚡: sales input and consolidation | Granular forecasts incorporating sales insights | New markets/products, detailed local knowledge | Detailed, sales accountability, local insights |
| Market Research & Survey-Based | Moderate 🔄: surveys and analysis | High ⚡: time & cost intensive | Qualitative insights, new product forecasts | New products, markets lacking historical data | Captures customer sentiment, qualitative data |
| Economic Indicator-Based | Moderate 🔄: economic analysis needed | Medium ⚡: economic data and expertise | Long-term impact of economic cycles on sales | Strategic planning, macroeconomic driven markets | Predicts economic impact, strategic planning |
From Examples to Execution: Building Your Hybrid Forecast
We have journeyed through a diverse landscape of sales forecasting methods, from the foundational Time Series Analysis to the forward-thinking power of Machine Learning. Each of these examples of sales forecasting serves a unique purpose, offering a different lens through which to view your future revenue. However, the most profound insight is that no single method operates in a vacuum. The true path to forecasting mastery lies not in choosing one "best" model, but in architecting a robust, hybrid approach that fits your specific business context.
Think of it as building a stronger, more resilient structure. You wouldn't build a skyscraper with just one material; you would use a combination of steel, concrete, and glass, each contributing its unique strengths. Your sales forecast deserves the same multi-faceted support system.
Synthesizing the Models for a Hybrid Approach
The core takeaway from the examples presented is the power of synthesis. Your goal is to move from reviewing isolated examples to executing a blended strategy.
Here is a practical framework for building your own hybrid forecast:
- Establish Your Foundation: Start with a quantitative baseline using Time Series Analysis. This grounds your forecast in the undeniable reality of your past performance, providing a crucial historical context and revealing seasonality.
- Layer on Real-Time Reality: Integrate your CRM-Based Pipeline Forecast. This shifts the focus from the past to the present, giving you granular, deal-by-deal visibility. It's your finger on the pulse of your current sales efforts.
- Incorporate Human Intelligence: Introduce a Bottom-Up Forecast by gathering insights directly from your sales representatives. They are on the front lines and possess invaluable qualitative information about deal health, customer sentiment, and competitive pressures that no algorithm alone can capture.
- Challenge with a Top-Down View: Validate your internal projections against external market realities using Market Research or Economic Indicator-Based Forecasting. This prevents organizational blind spots and ensures your targets are realistic within the broader economic climate.
Strategic Point: The most accurate forecasts are born from a healthy tension between different models. When your bottom-up forecast dramatically differs from your time-series analysis, it’s not a problem; it's an opportunity to ask critical questions and uncover deeper insights about your pipeline or market.
Turning a Forecast into a Strategic Asset
By applying the principles behind these examples of sales forecasting, you transform the process from a dreaded administrative task into a dynamic strategic tool. A well-constructed forecast does more than just predict revenue; it informs critical business decisions. It guides hiring plans, sets realistic marketing budgets, manages inventory, and helps secure investor confidence.
The journey doesn't end after you build your first hybrid model. The key is continuous iteration. Measure your forecast's accuracy against actual sales results each month or quarter. Identify where the variances occurred and refine your model accordingly. Was the CRM data too optimistic? Did an unforeseen economic shift invalidate your market research? This feedback loop is what turns a good forecast into an exceptional one. Mastering this process provides the clarity and confidence needed to navigate market uncertainty and steer your organization toward predictable, sustainable growth.
Ready to fuel your forecast with high-quality engagement data? The accuracy of any pipeline forecast depends on the data you feed it. Salesloop.io helps you build a more predictable pipeline by automating personalized outreach, ensuring you have a steady stream of qualified leads and the critical engagement metrics, like open and reply rates, needed to make your forecasting models more reliable. See how it works at Salesloop.io.

How to Prioritize Sales Leads for B2B Growth