
If you only track total revenue, you're missing half the story. It's like knowing you finished a road trip, but having no idea how fast you were driving, where you hit traffic, or how you could get there faster next time.
That’s where sales velocity comes in. Think of it as the speedometer for your sales engine. It’s a crucial metric that measures how quickly deals move through your pipeline to become actual, spendable revenue.
What Is Sales Velocity Really Measuring?
Let’s cut through the jargon. At its core, sales velocity tells you how fast your business is making money by tracking the speed at which opportunities turn into closed-won deals.
To get this right, you need a solid foundation of empowering sales data. Without clean, reliable data flowing from your CRM, you’re just guessing. You're flying blind.
This image of a speedometer is the perfect way to visualize it. It’s a real-time gauge of your revenue engine's performance.
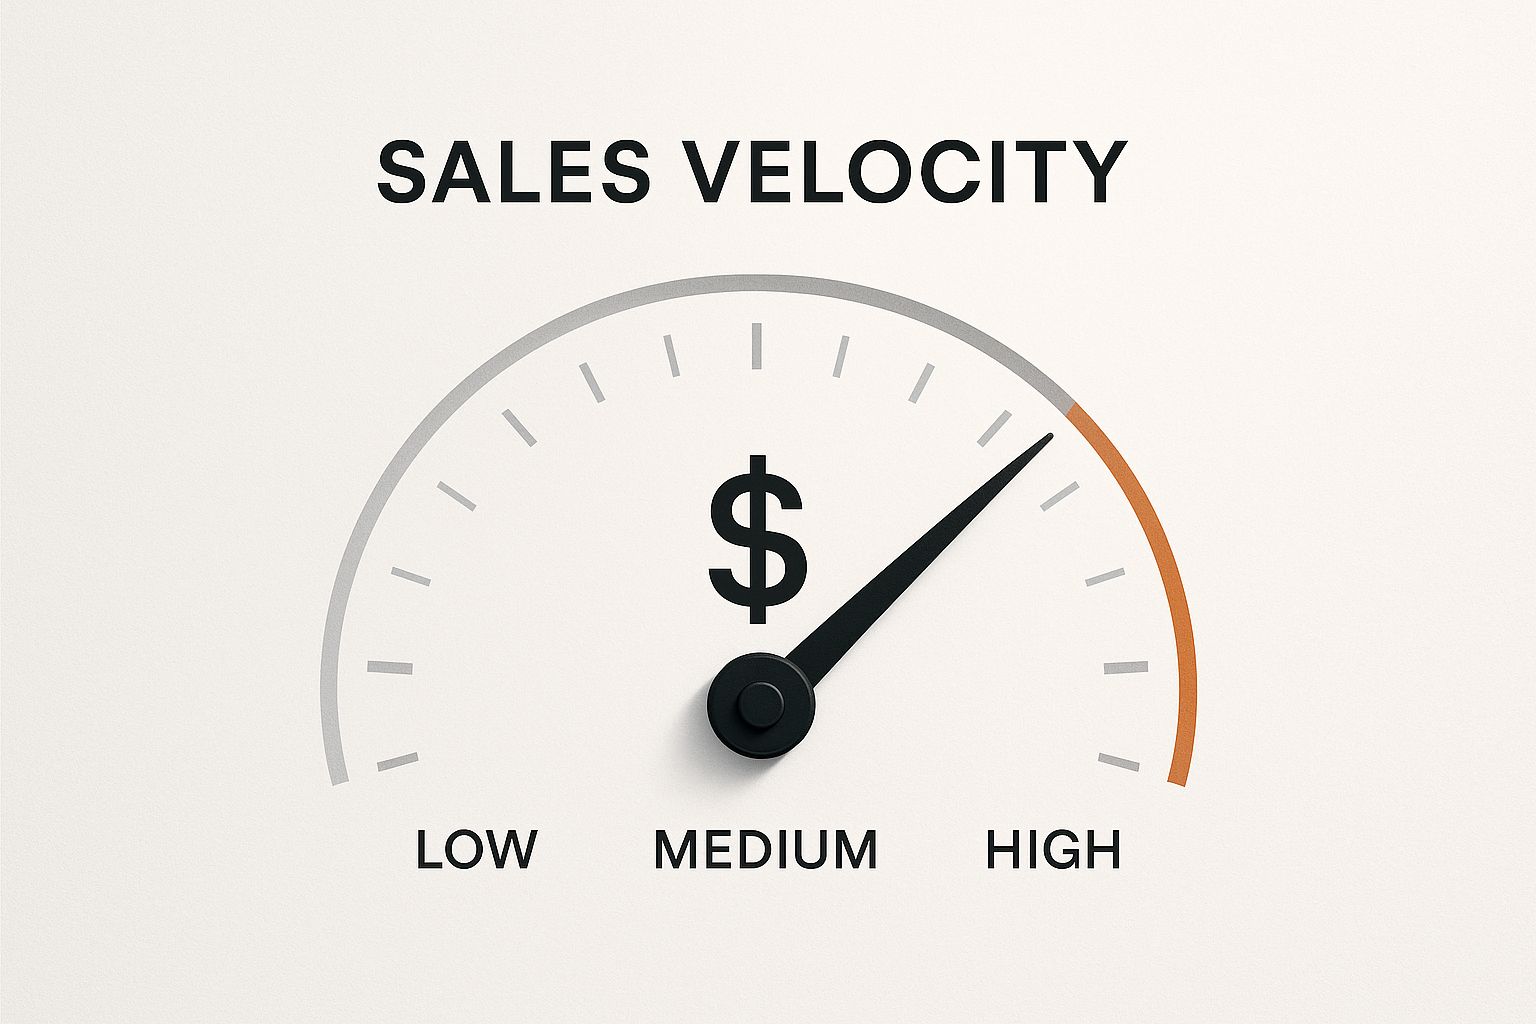
A higher reading on this gauge means a healthier, faster sales process. Simple as that. Understanding this metric is the first step toward building a more predictable and powerful sales machine.
The Four Levers of Sales Velocity
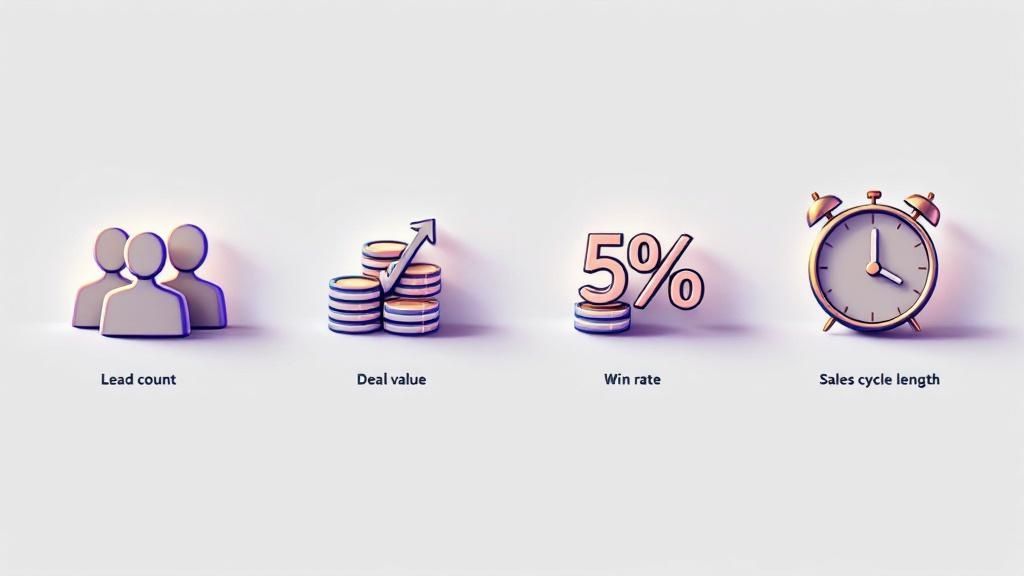
Sales velocity isn’t some abstract concept; it's a tangible outcome. It's the product of four distinct, interconnected components that you can actually influence. Each one acts as a lever you can pull to speed things up.
By measuring these four levers, you shift from hoping for revenue to strategically engineering it. It gives you a clear, diagnostic view of your sales process, showing you exactly where to focus your efforts for the biggest impact.
The whole concept boils down to a specific formula:
Sales Velocity = (Number of Opportunities × Average Deal Value × Win Rate) / Sales Cycle Length
For example, imagine your team has 100 qualified opportunities, an average deal size of $5,000, and a win rate of 20%. If your average sales cycle is 4 months long, your sales velocity is $25,000 per month.
This isn't just a math problem—it's a powerful diagnostic tool. Let's break down each component.
The Four Levers of Sales Velocity
| Component | What It Measures | Impact on Velocity |
|---|---|---|
| Number of Opportunities | The total count of qualified leads in your pipeline during a set period. | More high-quality "at-bats" increase your potential to score. |
| Average Deal Size | The average dollar value of a single closed-won deal. | Bigger deals mean more revenue from each successful close. |
| Win Rate | The percentage of opportunities that become paying customers. | A higher win rate means your team is closing more efficiently. |
| Sales Cycle Length | The average time it takes for a deal to go from first contact to signed contract. | A shorter cycle means you get cash in the door faster. |
Grasping how these four levers work together is the key. Once you do, you have the framework you need to diagnose bottlenecks and start fine-tuning your entire sales process for maximum speed and revenue.
Calculating Your Sales Velocity Step by Step
Alright, theory is one thing, but the real magic happens when you get your hands dirty with the data. It's time to roll up your sleeves and actually calculate your own sales velocity. I'll walk you through how to find the four key variables using data you almost certainly have sitting in your CRM right now.
Think of this as turning a pile of abstract data points into one, single number that tells you how fast your revenue engine is really running.
Step 1: Gather Your Four Key Metrics
Before you can start plugging numbers into the formula, you need to collect them. The first decision is picking a time period to analyze. Most teams I work with find a quarterly or monthly review hits the sweet spot. For this walkthrough, let's use the previous quarter (90 days).
You'll need to pull these four data points directly from your sales or CRM software:
- Number of Qualified Opportunities (#): How many real, qualified leads did your team work in that 90-day window?
- Average Deal Value ($): When you won a deal, what was the average contract worth in that same timeframe?
- Win Rate (%): Of those qualified opportunities, what percentage did you actually close?
- Sales Cycle Length (Days): From the moment an opportunity was "qualified" to the day it was marked "won," how long did it take on average?
Got those four numbers? Great. That's everything you need.
Step 2: Define and Find Each Variable
Now for the important part: accuracy. The old "garbage in, garbage out" rule applies here in a big way. If your inputs are sloppy, your sales velocity number will be completely useless. Let's make sure you're pulling the right data.
Number of Opportunities
This isn't just every name that dropped into your inbox. We're talking about the total number of sales-qualified opportunities (SQOs) created in your chosen timeframe. An SQO should meet your team's specific criteria—things like a confirmed budget, a clear need, and an identified decision-maker.
- Where to find it: Hop into your CRM. Filter for all new deals or opportunities created within your 90-day period that hit the "Qualified" stage in your pipeline.
- Example Value: Let's say you generated 200 qualified opportunities last quarter.
Average Deal Value
This is simply the average value of all the deals you marked "closed-won" during the period. A quick pro-tip: to avoid wonky results, it’s often a good idea to exclude any massive outliers, like that one deal that was 10 times bigger than anything else you closed.
- Where to find it: Add up the total revenue from all your won deals in the 90-day period. Then, just divide that by the number of deals you won.
- Example Value: Your team closed 40 deals that brought in a total of $800,000. Your average deal value is $20,000.
Win Rate
This is a straightforward measure of how effective your team is. It’s the percentage of qualified opportunities that your reps successfully turned into paying customers.
- Where to find it: Divide the number of "closed-won" deals by the total number of qualified opportunities from that same group.
- Example Value: You won 40 deals from 200 qualified opportunities, so your win rate is 20% (which we'll use as 0.20 in the formula).
A Note on Timing: This is critical. Make sure your opportunities, deal values, and win rate all come from the same cohort of leads. Mismatching timeframes is a classic mistake that throws the whole calculation off.
Sales Cycle Length
This metric tracks the speed of your sales process. It’s the average number of days it takes for a deal to go from being qualified to being closed-won.
- Where to find it: Most CRMs can spit this out for you. Run a report on your closed-won deals for the period and look for the average "days to close."
- Example Value: Your report shows that the average deal took 60 days from qualification to close.
Step 3: Put It All Together
Okay, let's plug our numbers into the sales velocity formula and see what we get.
-
Formula: (Number of Opportunities × Average Deal Value × Win Rate) / Sales Cycle Length
-
Calculation: (200 opportunities × $20,000 × 0.20) / 60 days
-
Result: $800,000 / 60 days = $13,333 per day
So, what does this mean? This B2B company is generating revenue at a velocity of $13,333 per day. If you multiply that by 30, you get a monthly velocity of about $400,000. This one number is now your baseline—a powerful benchmark you can use to track performance and drive improvements.
Why Sales Velocity Is a Vital Health Check for Your Business
Knowing what sales velocity is and how to calculate it is just the starting line. The real magic happens when you start using it as a diagnostic tool for your business's overall health. It helps you look past simple revenue numbers to understand the true efficiency of your entire sales engine.
Think of it this way: traditional revenue reports are like a snapshot. They tell you where you are at a single moment in time. Sales velocity, on the other hand, is like a continuous EKG, monitoring the very heartbeat of your sales process. It’s a leading indicator, giving you a dynamic view of how well your team is actually turning opportunities into cash.
This forward-looking view is absolutely crucial for proactive leadership. A sudden dip in your velocity can be an early warning sign, flagging trouble long before it ever shows up in your quarterly revenue reports.
Uncovering Hidden Pipeline Problems
A slowing sales velocity is often the first symptom of deeper issues lurking in your sales pipeline. It forces you to ask the tough questions that a simple revenue figure just can't answer. Is the pipeline clogged at a specific stage? Are deals constantly stalling out during negotiation?
Think about what a change in velocity can expose:
- A Drop in Win Rate: This could mean your team is getting outmaneuvered by a new competitor, or maybe a recent product update isn't hitting the mark with prospects.
- A Lengthening Sales Cycle: If deals are dragging on longer than usual, your process might have become too clunky, or perhaps you've started targeting a more indecisive type of customer.
- A Decrease in Opportunities: A shrinking number of deals entering the pipeline points straight to the top of your funnel. This is a classic sign you might need to check out our guide on how to automate lead generation to keep the opportunities flowing.
By spotting these issues early, you can step in with targeted training, process tweaks, or strategic shifts before a small hiccup snowballs into a major revenue crisis.
The SaaS Litmus Test
For Software as a Service (SaaS) companies, sales velocity is especially important. In a world of recurring revenue and the constant need for rapid growth, it’s a core measure of sustainability.
For example, a typical mid-sized B2B SaaS company might have 50 qualified opportunities per quarter. With an average deal size of $20,000, a 15% win rate, and a sales cycle of 3 months, their sales velocity comes out to $50,000 per month in expected revenue. This isn't just an internal number; it's a key figure for investors and strategic planning.
This focus on speed and efficiency makes sales velocity a non-negotiable KPI for any SaaS business looking to scale. It directly reflects the health of the customer acquisition engine that fuels growth.
Driving More Accurate Forecasting
At the end of the day, one of the biggest wins from tracking sales velocity is the ability to forecast future revenue with much greater accuracy. Traditional forecasting often leans on gut feelings and overly optimistic pipeline values. Velocity, however, is rooted in cold, hard data.
When you know how much revenue your process actually generates per day or month, you can build far more realistic projections. This data-driven approach leads to smarter resource allocation, better hiring decisions, and more confident strategic planning across the board.
Of course, sales velocity is just one piece of the puzzle. It's a critical metric, but it operates within a larger ecosystem of data. For a complete picture, it's worth exploring other essential SaaS KPIs that drive business growth. By treating sales velocity as a vital health check, you turn it from a passive number into an active tool for building a more resilient and predictable business.
Actionable Strategies to Increase Your Sales Velocity
Alright, you understand what sales velocity is and you’ve got your baseline number. Now for the fun part: putting that knowledge to work and making your revenue climb faster.
Speeding up your sales velocity is all about systematically improving one (or more) of the four levers in the formula. This isn't about just cracking the whip and telling your team to "sell harder." It's about working smarter by making targeted tweaks to each component.
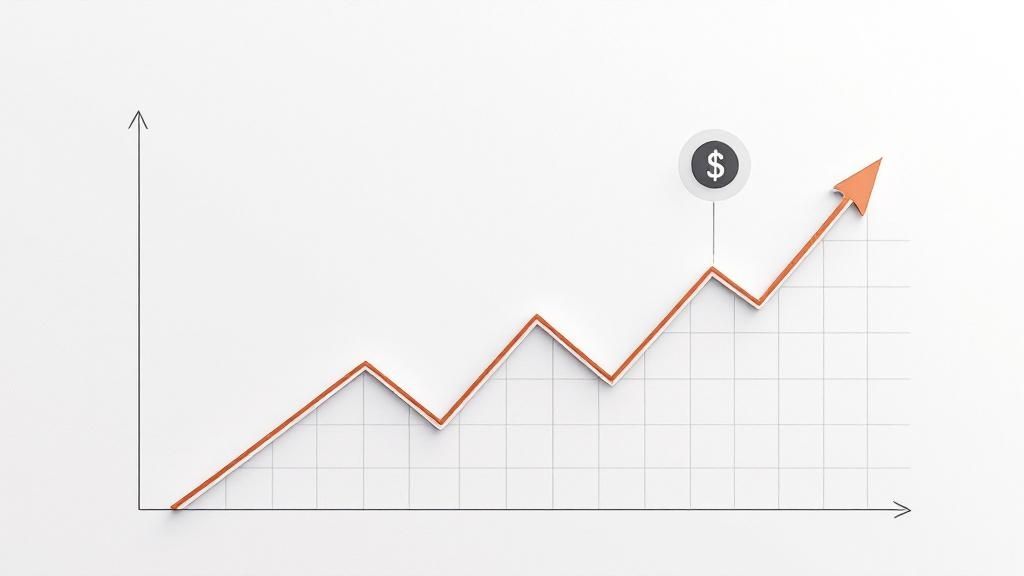
Don't underestimate the power of small, focused improvements here. For example, a recent report showed that companies boosting their win rate by just 5% could see their sales velocity jump by around 25%, even if nothing else changes. Think about that. Similarly, cutting a six-month sales cycle down to four months can increase velocity by a staggering 50%. These are the kinds of gains that directly accelerate how quickly you bring in cash.
Boost Your Number of Opportunities
Everything starts at the top of the funnel. If you don't have a healthy flow of quality leads coming in, the rest of the formula doesn't matter much. The key word here is quality. The goal isn't just more leads; it's more of the right leads.
Here’s how to fill your pipeline with better opportunities:
- Refine Your Ideal Customer Profile (ICP): Go deeper than just company size and industry. Dig into the traits of your absolute best customers. What are their real pain points, what goals are they trying to hit, and what does their buying process look like? A laser-focused ICP ensures your marketing and sales efforts hit the bullseye.
- Strengthen Lead Qualification: Get a solid lead scoring system in place. Frameworks like BANT (Budget, Authority, Need, Timeline) are great for this. It stops your reps from burning precious time on dead-end leads and lets them pour their energy into a deals that can actually close.
- Invest in Targeted Lead Generation: Stop casting a wide net and hoping for the best. For example, implementing robust search engine marketing best practices can dramatically improve both the volume and quality of your inbound leads, giving a direct shot in the arm to your sales velocity.
Increase Your Average Deal Value
Getting more from each customer is one of the most direct ways to boost your velocity. Honestly, it’s often easier to add more value to an existing deal than it is to hunt down a brand new one. The trick is to bump up that transaction size without making the sales process more complicated.
Try these tactics to get your average deal size moving up:
- Strategic Upselling and Cross-selling: Look for no-brainer add-ons or premium tiers that solve another problem for your customer. Coach your reps to spot these moments in conversation and frame them as helpful solutions, not just another line item.
- Introduce Tiered Pricing: Structure your products or services into clear packages (e.g., Basic, Pro, Enterprise). This nudges customers to pick the plan that truly fits their needs, often pushing them toward higher-value options and pulling your average deal size up with them.
- Focus on Value Over Price: Shift the entire conversation away from cost and toward ROI. Make sure your team is armed with killer case studies, glowing testimonials, and hard data that proves the value you deliver. When a prospect truly understands the return, the price becomes much less of an issue.
Improve Your Win Rate
Your win rate is the ultimate report card for your sales team's effectiveness. Even a tiny bump in this metric creates a ripple effect across your entire sales velocity. Improving it means fine-tuning every single touchpoint a prospect has with your team.
A higher win rate is the clearest sign that your message is resonating and your process is working. It reflects how well you understand your customer's needs and how effectively you communicate your value.
Here's how to start closing more of the deals you're already working:
- Refine Your Sales Script and Messaging: A sales script shouldn't be a straitjacket. Treat it as a flexible guide that helps steer conversations, zero in on key pain points, and nail your unique value proposition every time.
- Master Objection Handling: Get a list going of the most common objections your team hears. Then, work together to develop solid, value-driven answers for each one. Role-playing these scenarios is a fantastic way to build the confidence reps need for those tough conversations.
- Create a Competitive Battlecard: Give your team a cheat sheet on your main competitors. It should clearly lay out your strengths, their weaknesses, and what makes you different. This helps your reps position your solution as the obvious choice and is just one of many sales performance metrics examples that give your team a real edge.
Shorten Your Sales Cycle Length
In sales, time really is money, and a long sales cycle is a velocity killer. The longer a deal languishes in your pipeline, the more resources it sucks up and the higher the chance it dies on the vine. The goal is to grease the wheels and help prospects make a decision more efficiently.
- Automate Low-Value Tasks: Use automation tools for the repetitive stuff like sending follow-up emails or scheduling meetings. This frees up your reps to do what they do best: building relationships and closing deals.
- Remove Friction Points: Put yourself in your customer’s shoes and map out their entire journey with you. Find the bottlenecks—is it a nightmare contract review process? Too many demos? Find those sticky points and smooth them out.
- Create Genuine Urgency: This isn't about sleazy, high-pressure tactics. You can create real urgency by tying your solution to a customer's critical business deadline or offering a smart, time-sensitive incentive that encourages them to pull the trigger sooner rather than later.
Common Mistakes That Will Invalidate Your Calculation
Tracking sales velocity is an incredibly powerful practice, but it's only as good as the numbers you feed it. A poorly calculated velocity figure isn't just a vanity metric; it’s a broken compass. It can lead to terrible forecasts, wasted resources, and strategies that are dead on arrival.
To make sure your insights are reliable, you have to sidestep a few common pitfalls that can completely throw off your results.
The first and most common error? Polluting your calculation with junk leads. It's so tempting to cram every single inquiry into your "Number of Opportunities" to make your pipeline look full and busy. But this creates a dangerously false sense of security.
These low-quality leads almost never convert. They artificially tank your win rate and drag out your sales cycle length because reps are wasting time on deals that were never going to close in the first place. For a true read on your sales velocity, you have to be disciplined. Only include leads that have been properly qualified against your criteria.
Ignoring Outlier Deals
Another critical mistake is forgetting to account for outliers. Every company has them—that one massive, once-in-a-decade deal that was ten times your average size, or a few tiny deals that closed lightning-fast. Letting these anomalies into your calculation can dramatically skew your Average Deal Value and Sales Cycle Length.
If that one huge deal inflates your average, you’ll end up setting completely unrealistic revenue forecasts. On the flip side, if a few small, quick wins artificially shorten your average cycle time, you might create false urgency or misdiagnose how efficient your sales process really is. For an accurate, repeatable metric, it’s often best to exclude the extreme outliers from your core calculation.
The goal of measuring sales velocity isn't to get the biggest number possible; it's to get the most accurate number possible. Clean, consistent data is the foundation of any reliable sales metric.
Sacrificing One Lever for Another
Finally, a major strategic blunder is obsessing over one lever at the expense of the others. The four components of sales velocity exist in a delicate balance. Pushing on one almost always affects the others.
For example, a sales manager might decide to drastically slash prices to shorten the sales cycle. Sure, the cycle length might shrink, but that move will almost certainly crush the Average Deal Value. In the end, the net effect on your overall sales velocity could be zero—or even negative.
Here are a couple more examples of this flawed thinking:
- Flooding the pipeline: Pushing marketing to generate more leads without a focus on quality might boost your "opportunities," but your win rate will plummet.
- Chasing only whales: Focusing exclusively on huge accounts can increase deal value, but it often lengthens the sales cycle and lowers the win rate. A poor win rate can be a symptom of many issues, and it's worth understanding what a good sales conversion rate looks like for your industry as a benchmark.
Ultimately, a healthy approach involves making balanced, strategic tweaks across all four levers. You have to ensure that a gain in one area doesn't cause a crippling loss somewhere else.
Common Questions About Sales Velocity
Even when you've got a handle on the theory, putting a new metric like sales velocity into practice always brings up some real-world questions. Let's tackle a few of the most common ones we hear from sales leaders.
How Often Should I Calculate It?
For most B2B sales teams, running the numbers on a quarterly basis hits the sweet spot. It's frequent enough that you can spot trends and make meaningful tweaks to your process before things go off the rails.
At the same time, a quarterly view is long enough to smooth out the random, week-to-week noise that could send you chasing ghosts. Monthly checks can work if you're in a super fast-paced market or A/B testing a big change, but annual calculations are just too slow to be useful for steering the ship.
What Tools Do I Need to Track Sales Velocity?
You absolutely need a modern CRM. Trying to do this in a spreadsheet is a recipe for frustration and inaccurate data. Platforms like Salesforce, HubSpot, or Zoho are built for this.
A good CRM automatically logs all four pieces of the sales velocity puzzle:
- How many opportunities are in your pipeline
- The average value of those deals
- Your historical win/loss rates
- The time it takes for deals to move through each stage
Using a CRM as your source of truth makes the calculation a simple report-pull away and ensures you're working with clean, reliable data.
Key Takeaway: Stop looking for a magic industry number. The most important sales velocity benchmark is your own historical performance. The real goal is to get a little bit better—across all four drivers—every single quarter.
Can This Apply to Individual Sales Reps?
Absolutely. In fact, that's where it becomes a powerful coaching tool. Calculating sales velocity for each person on your team helps you pinpoint exactly who is crushing it, who is struggling, and why.
You might find one rep has an amazing win rate but a painfully long sales cycle. That tells you they’re a fantastic closer but might need some help creating urgency earlier in the process. Another might be flying through deals but at a lower average value, which is a perfect opportunity for coaching on upselling or negotiation tactics.
What Is a Good Sales Velocity Benchmark?
This is the million-dollar question, and the honest answer is: there's no universal "good" number. A company selling a high-volume, low-cost SaaS product will have a wildly different velocity than a firm closing massive, multi-year enterprise contracts.
Your only true benchmark is your own historical performance.
Start by establishing a baseline. Track your velocity this quarter, then next quarter, and the one after that. The goal isn't to hit some arbitrary industry target; it's to achieve steady, incremental improvement. Focus on beating your last quarter.
Ready to put the pedal down on your own sales velocity? Salesloop.io gives you the engine to automate lead generation, fill your pipeline with high-quality opportunities, and streamline your outreach. See how our platform helps you close more deals, faster, by visiting https://salesloop.io.

What Is Lead Qualification? A Practical Explainer